import cv2
import numpy as np
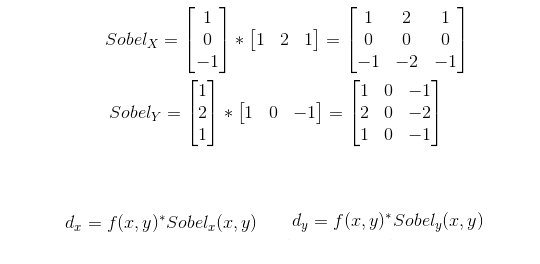
m1 = np.array([[1, 0, -1], [2, 0, -2], [1,
0, -1]])
m2 = np.array([[1, 2, 1], [0, 0, 0], [-1, -2,
-1]])
from matplotlib import pyplot as plt
# ЕквЛВНЃКЭъГЩИпЫЙЦНЛЌТЫВЈ
img = cv2.imread("B9064CF1D57871735CE11A0F368DCF27.jpg",
0)
sobel = cv2.Canny(img, 50, 100)
cv2.namedWindow('5', 0)
cv2.resizeWindow("5", 640, 480)
cv2.imshow("5", sobel) # НЧЖШжЕЛвЖШЭМ
img = cv2.GaussianBlur(img, (3, 3), 2)
# ЕкЖўВНЃКЭъГЩвЛНзгаЯоВюЗжМЦЫуЃЌМЦЫуУПвЛЕуЕФЬнЖШЗљжЕгыЗНЯђ
img1 = np.zeros(img.shape, dtype="uint8")
# гыдЭМДѓаЁЯрЭЌ
theta = np.zeros(img.shape, dtype="float")
# ЗНЯђОиеѓдЭМЯёДѓаЁ
img = cv2.copyMakeBorder(img, 1, 1, 1, 1, borderType=cv2.BORDER_REPLICATE)
rows, cols = img.shape
for i in range(1, rows - 1):
for j in range(1, cols - 1):
Gy = [np.sum(m2 * img[i - 1:i + 2, j - 1:j +
2])]
#Gy = (np.dot(np.array([1, 1, 1]), (m2 * img[i
- 1:i + 2, j - 1:j + 2]))).dot(np.array([[1],
[1], [1]]))
Gx = [np.sum(m1 * img[i - 1:i + 2, j - 1:j +
2])]
#Gx = (np.dot(np.array([1, 1, 1]), (m1 * img[i
- 1:i + 2, j - 1:j + 2]))).dot(np.array([[1],
[1], [1]]))
if Gx[0] == 0:
theta[i - 1, j - 1] = 90
continue
else:
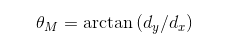
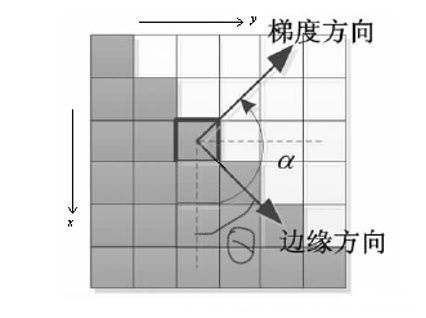
temp = ((np.arctan2(Gy[0], Gx[0])) * 180 / np.pi)+90
if Gx[0] * Gy[0] > 0:
if Gx[0] > 0:
# ЕквЛЯѓЯп
theta[i - 1, j - 1] = np.abs(temp)
else:
# ЕкШ§ЯѓЯп
theta[i - 1, j - 1] = (np.abs(temp) - 180)
if Gx[0] * Gy[0] < 0:
if Gx[0] > 0:
# ЕкЫФЯѓЯп
theta[i - 1, j - 1] = (-1) * np.abs(temp)
else:
# ЕкЖўЯѓЯп
theta[i - 1, j - 1] = 180 - np.abs(temp)
img1[i - 1, j - 1] = (np.sqrt(Gx[0] ** 2 + Gy[0]
** 2))
for i in range(1, rows - 2):
for j in range(1, cols - 2):
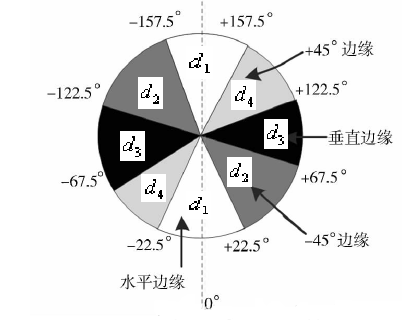
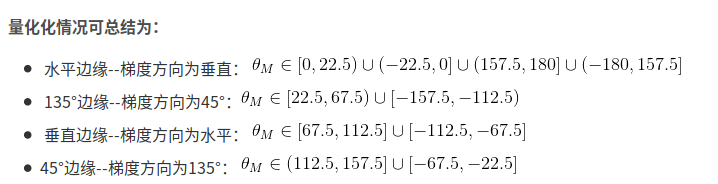
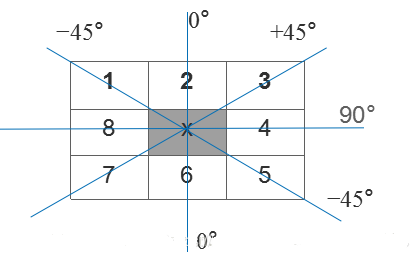
if (((theta[i, j] >= -22.5) and (theta[i,
j] < 22.5)) or
((theta[i, j] <= -157.5) and (theta[i, j]
>= -180)) or
((theta[i, j] >= 157.5) and (theta[i, j]
< 180))):
theta[i, j] = 0.0
elif (((theta[i, j] >= 22.5) and (theta[i,
j] < 67.5)) or
((theta[i, j] <= -112.5) and (theta[i, j]
>= -157.5))):
theta[i, j] = -45.0
elif (((theta[i, j] >= 67.5) and (theta[i,
j] < 112.5)) or
((theta[i, j] <= -67.5) and (theta[i, j]
>= -112.5))):
theta[i, j] = 90.0
elif (((theta[i, j] >= 112.5) and (theta[i,
j] < 157.5)) or
((theta[i, j] <= -22.5) and (theta[i, j]
>= -67.5))):
theta[i, j] = 45.0
'''
for i in range(1, rows - 1):
for j in range(1, cols - 1):
Gy = [np.sum(m2 * img[i - 1:i + 2, j - 1:j +
2])]
#Gy = (np.dot(np.array([1, 1, 1]), (m2 * img[i
- 1:i + 2, j - 1:j + 2]))).dot(np.array([[1],
[1], [1]]))
Gx = [np.sum(m1 * img[i - 1:i + 2, j - 1:j +
2])]
#Gx = (np.dot(np.array([1, 1, 1]), (m1 * img[i
- 1:i + 2, j - 1:j + 2]))).dot(np.array([[1],
[1], [1]]))
if Gx[0] == 0:
theta[i - 1, j - 1] = 90
continue
else:
temp = (np.arctan2(Gy[0], Gx[0])) * 180 / np.pi)
if Gx[0] * Gy[0] > 0:
if Gx[0] > 0:
# ЕквЛЯѓЯп
theta[i - 1, j - 1] = np.abs(temp)
else:
# ЕкШ§ЯѓЯп
theta[i - 1, j - 1] = (np.abs(temp) - 180)
if Gx[0] * Gy[0] < 0:
if Gx[0] > 0:
# ЕкЫФЯѓЯп
theta[i - 1, j - 1] = (-1) * np.abs(temp)
else:
# ЕкЖўЯѓЯп
theta[i - 1, j - 1] = 180 - np.abs(temp)
img1[i - 1, j - 1] = (np.sqrt(Gx[0] ** 2 + Gy[0]
** 2))
for i in range(1, rows - 2):
for j in range(1, cols - 2):
if (((theta[i, j] >= -22.5) and (theta[i,
j] < 22.5)) or
((theta[i, j] <= -157.5) and (theta[i, j]
>= -180)) or
((theta[i, j] >= 157.5) and (theta[i, j]
< 180))):
theta[i, j] = 90.0
elif (((theta[i, j] >= 22.5) and (theta[i,
j] < 67.5)) or
((theta[i, j] <= -112.5) and (theta[i, j]
>= -157.5))):
theta[i, j] = 45.0
elif (((theta[i, j] >= 67.5) and (theta[i,
j] < 112.5)) or
((theta[i, j] <= -67.5) and (theta[i, j]
>= -112.5))):
theta[i, j] = 0.0
elif (((theta[i, j] >= 112.5) and (theta[i,
j] < 157.5)) or
((theta[i, j] <= -22.5) and (theta[i, j]
>= -67.5))):
theta[i, j] = -45.0
'''
# ЕкШ§ВНЃКНјаа ЗЧМЋДѓжЕвжжЦМЦЫу
img2 = np.zeros(img1.shape) # ЗЧМЋДѓжЕвжжЦЭМЯёОиеѓ
for i in range(1, img2.shape[0] - 1):
for j in range(1, img2.shape[1] - 1):
# 0ЖШjВЛБф
if (theta[i, j] == 0.0) and (img1[i, j] == np.max([img1[i,
j], img1[i + 1, j], img1[i - 1, j]])):
img2[i, j] = img1[i, j]
if (theta[i, j] == -45.0) and img1[i, j] ==
np.max([img1[i, j], img1[i - 1, j - 1], img1[i
+ 1, j + 1]]):
img2[i, j] = img1[i, j]
if (theta[i, j] == 90.0) and img1[i, j] ==
np.max([img1[i, j], img1[i, j + 1], img1[i,
j - 1]]):
img2[i, j] = img1[i, j]
if (theta[i, j] == 45.0) and img1[i, j] ==
np.max([img1[i, j], img1[i - 1, j + 1], img1[i
+ 1, j - 1]]):
img2[i, j] = img1[i, j]
# ЕкЫФВНЃКЫЋуажЕМьВтКЭБпдЕСЌНг
img3 = np.zeros(img2.shape) # ЖЈвхЫЋуажЕЭМЯё
# TL = 0.4*np.max(img2)
# TH = 0.5*np.max(img2)
TL = 50
TH = 100
# ЙиМќдкетСНИіуажЕЕФбЁдё
for i in range(1, img3.shape[0] - 1):
for j in range(1, img3.shape[1] - 1):
if img2[i, j] < TL:
img3[i, j] = 0
elif img2[i, j] > TH:
img3[i, j] = 255
elif ((img2[i + 1, j] < TH) or (img2[i -
1, j] < TH) or (img2[i, j + 1] < TH) or
(img2[i, j - 1] < TH) or (img2[i - 1, j -
1] < TH) or (img2[i - 1, j + 1] < TH)
or
(img2[i + 1, j + 1] < TH) or (img2[i + 1,
j - 1] < TH)):
img3[i, j] = 255
cv2.namedWindow('1', 0)
cv2.resizeWindow("1", 640, 480)
cv2.namedWindow('2', 0)
cv2.resizeWindow("2", 640, 480)
cv2.namedWindow('3', 0)
cv2.resizeWindow("3", 640, 480)
cv2.namedWindow('4', 0)
cv2.resizeWindow("4", 640, 480)
cv2.imshow("1", img) # дЪМЭМЯё
cv2.imshow("2", img1) # ЬнЖШЗљжЕЭМ
cv2.imshow("3", img2) # ЗЧМЋДѓжЕвжжЦЛвЖШЭМ
cv2.imshow("4", img3) # зюжеаЇЙћЭМ
cv2.waitKey(0) |