| БрМЭЦМі: |
БОЮФжївЊНщЩмСЫвЛаЉЪ§ОнЧхРэЕФЫМТЗвдМАШчКЮХРШЁЪ§ОнЃЌВЂДІРэЪ§ОнЪЙжЎПЩЪгЛЏЃЌЯЃЭћЖдДѓМвгаАяжњЁЃ
БОЮФРДздгкcsdn ЃЌгЩЛ№СњЙћШэМўAliceБрМЃЌЭЦМіЁЃ |
|
1.Ъ§ОнЭкОђ
ДњТыЫљашАќ
import urllib.request
import xlwt
import re
import urllib.parse
import time |
НјШыЧАГЬЮогЧЙйЭј
ЮветРявдЫбЫїДѓЪ§ОнжАЮЛаХЯЂ

ДђПЊПЊЗЂепФЃЪН
Request Headers РяУцЪЧЮвУЧгУфЏРРЦїЗУЮЪЭјеОЕФаХЯЂЃЌгаСЫаХЯЂКѓОЭФмФЃФтфЏРРЦїЗУЮЪ
етвВЪЧЮЊСЫЗРжЙЭјеОЗтНћIPЃЌВЛЙ§ЧАГЬЮогЧвЛАуЪЧВЛЛсЗтIPЕФЁЃ
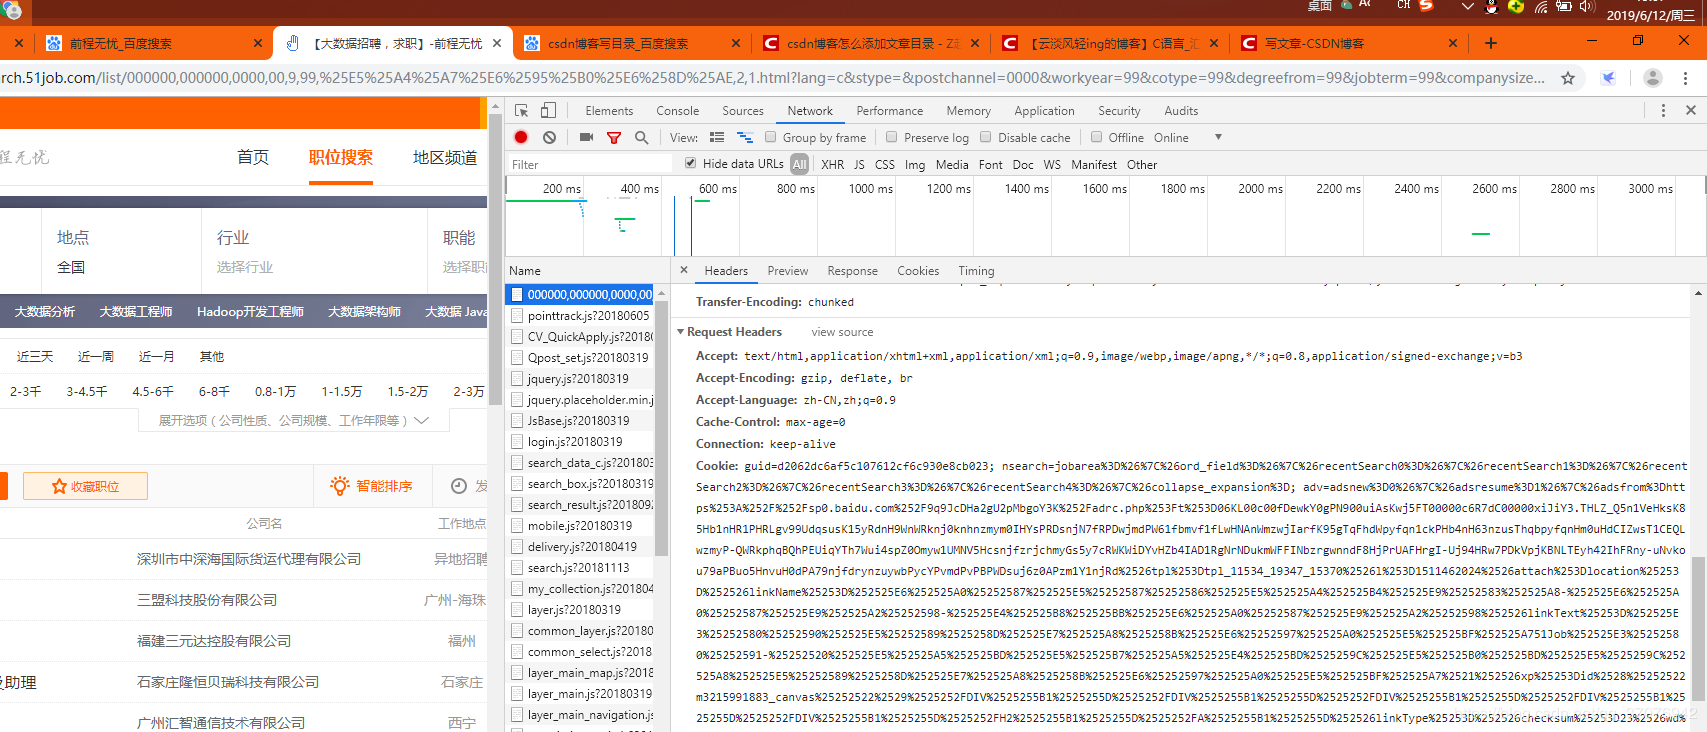
ФЃФтфЏРРЦї
header={
'Host':'search.51job.com',
'Upgrade-Insecure-Requests':'1',
'User-Agent':'Mozilla/5.0 (Windows NT 10.0; Win64;
x64) AppleWebKit/537.36 (KHTML, like Gecko) Chrome/78.0.3904.108
Safari/537.36'
}
|
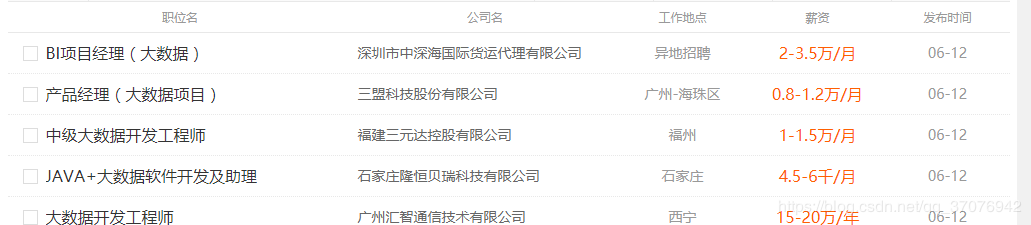
етаЉЛљБОЪ§ОнЖМПЩвдХРШЁЃК
ЮЊСЫЪЕЯжНЛЛЅаЭХРШЁЃЌЮваДСЫвЛИіФмЙЛЪЕЯжЪфШыЯыСЫНтЕФжАЮЛОЭФмХРШЁЯрЙиФкШнЕФКЏЪ§
def getfront(page,item):
#pageЪЧвГЪ§ЃЌ
itemЪЧЪфШыЕФзжЗћДЎЃЌМћКѓЮФ
result = urllib.parse.quote(item) #ЯШАбзжЗћДЎ
зЊГЩЪЎСљНјжЦБрТы
ur1 = result+',2,'+ str(page)+'.html'
ur2 = 'https://search.51job.com/list
/000000,000000,0000,00,9,99,'
res = ur2+ur1 #ЦДНгЭјжЗ
a = urllib.request.urlopen(res)
html = a.read().decode('gbk')
# ЖСШЁдДДњТыВЂзЊЮЊunicode
return html
|
def getInformation(html):
reg = re.compile(r'class="t1 ">.*?
<a target="_blank"
title="(.*?)" href="(.*?)".*?
<span class="t2"><
a target="_blank" title="(.*?)"
href="(.*?)".*?
<span class="t3">(.*?)</span>.*?<span
class="t4">(
.*?)</span>.*?<span
class="t5">(.*?)</span>.*?',re.S)
#ЦЅХфЛЛааЗћ
items=re.findall(reg,html)
return items
|
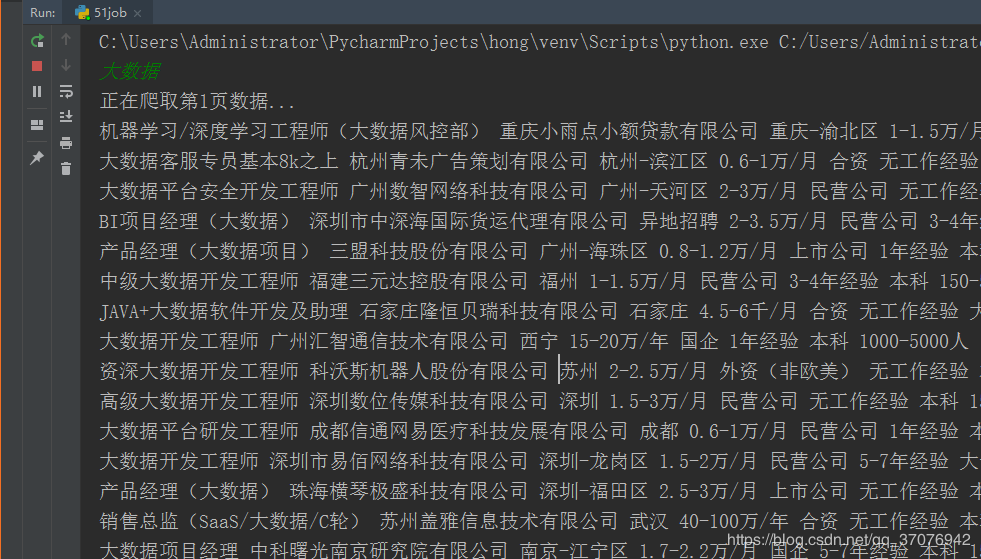
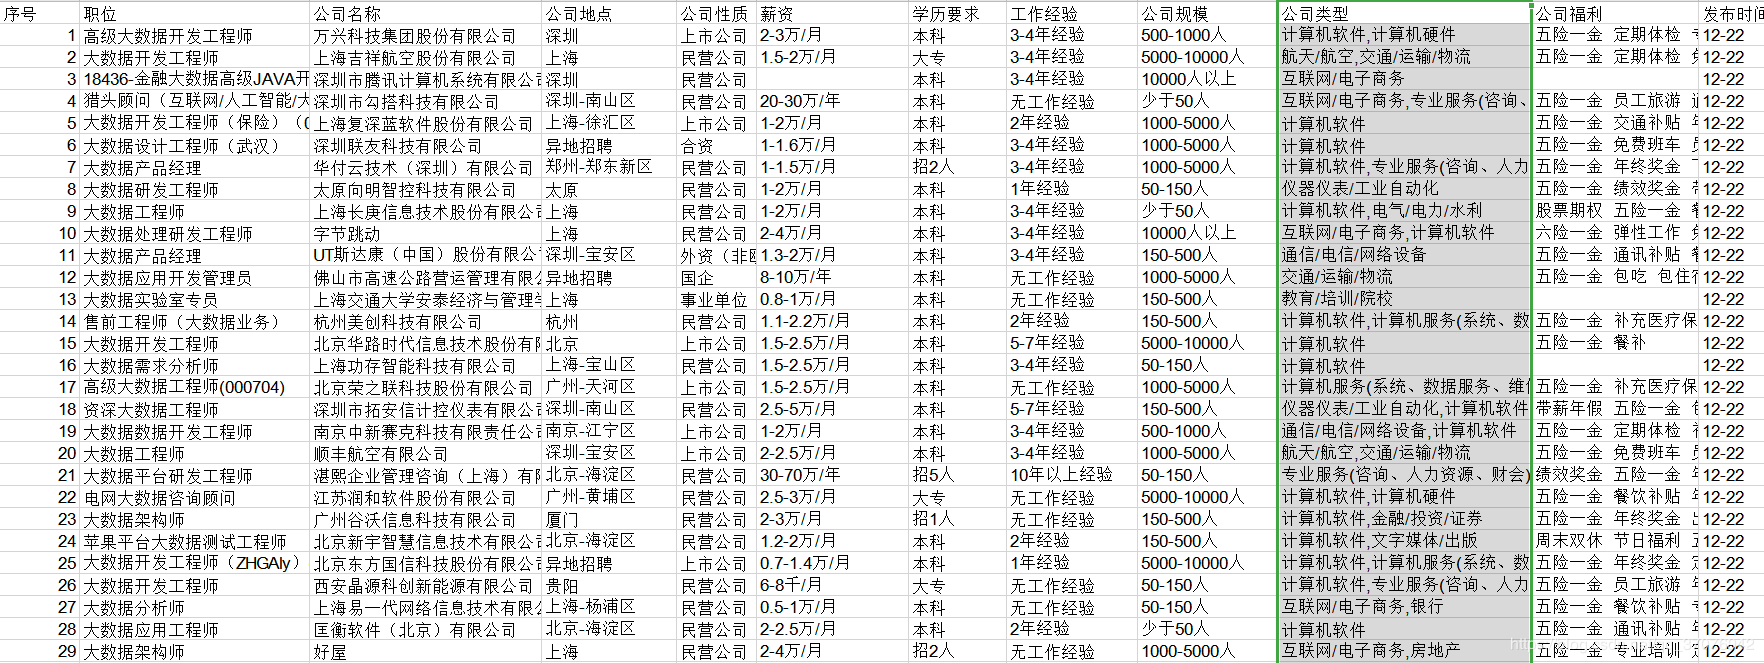
етРяЮвГ§СЫХРШЁЭМЩЯаХЯЂЭтЃЌЛЙАбжАЮЛГЌСДНгКѓЕФЭјжЗЃЌвдМАЙЋЫОГЌСДНгЕФЭјжЗХРШЁЯТРДСЫЁЃ
етРяЯШВЛНВЃЌКѓУцКѓУцЛсЫЕЕНЃЌ
НгЯТРДОЭашвЊДЂДцаХЯЂЃЌетРяЪЙгУExcelЃЌЫфШЛБШНЯТщЗГЃЌВЛЙ§ЪЄдкЧхЮњжБЙл
#аТНЈБэИёПеМф
excel1 = xlwt.Workbook()
# ЩшжУЕЅдЊИёИёЪН
sheet1 = excel1.add_sheet('Job', cell_overwrite_ok=True)
sheet1.write(0, 0, 'ађКХ')
sheet1.write(0, 1, 'жАЮЛ')
sheet1.write(0, 2, 'ЙЋЫОУћГЦ')
sheet1.write(0, 3, 'ЙЋЫОЕиЕу')
sheet1.write(0, 4, 'ЙЋЫОаджЪ')
sheet1.write(0, 5, 'аНзЪ')
sheet1.write(0, 6, 'бЇРњвЊЧѓ')
sheet1.write(0, 7, 'ЙЄзїОбщ')
sheet1.write(0, 8, 'ЙЋЫОЙцФЃ')
sheet1.write(0, 9, 'ЙЋЫОРраЭ')
sheet1.write(0, 10,'ЙЋЫОИЃРћ')
sheet1.write(0, 11,'ЗЂВМЪБМф') |
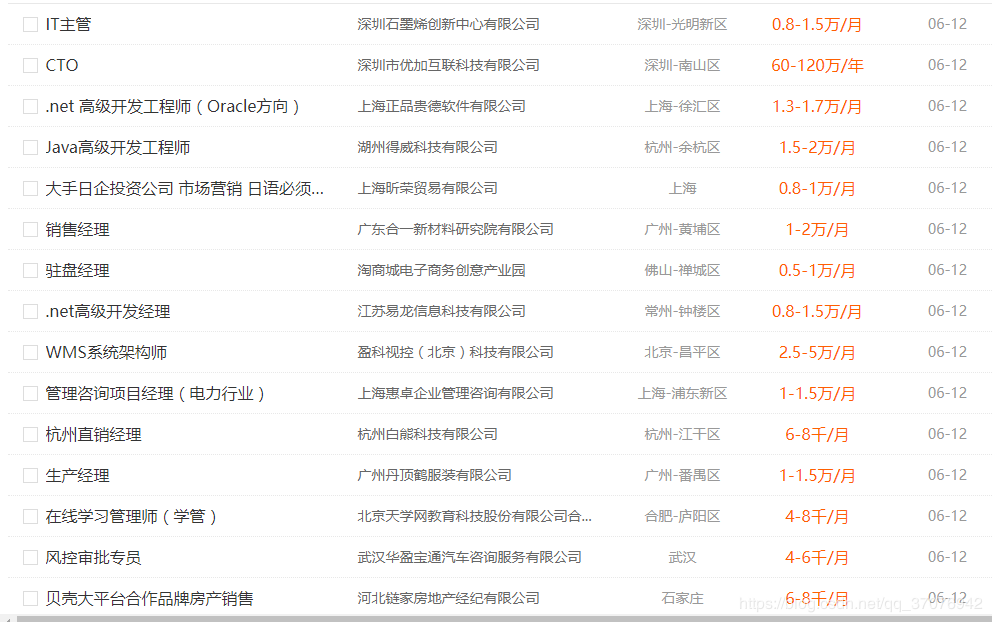
ХРШЁДњТыШчЯТЃЌетРяОЭФмРћгУЫЋВубЛЗРДЪЕЯжЛЛвГХРШЁгыЛЛааЪфГі
ЮветРяЮЊСЫЛёЕУДѓСПЪ§ОнЫљвдХРШЁСЫ1000вГЃЌЕїЪдЪБПЩвджЛХРШЁМИвГ
number = 1
item = input()
for j in range(1,10000): #вГЪ§здМКЫцБуИФ
try:
print("е§дкХРШЁЕк"+str(j)+"вГЪ§Он...")
html = getfront(j,item) #ЕїгУЛёШЁЭјвГдТы
for i in getInformation(html):
try:
url1 = i[1] #жАЮЛЭјжЗ
res1 = urllib.request.urlopen(url1).read().
decode('gbk')
company = re.findall(re.compile
(r'<div class="com_tag">.
*?<p
class="at" title="(.*?)"><span
class="
i_flag">.*?
<p class="at"
title="(.*?)">.*?<p class="at"
title="(.*?)
">.*?',re.S),res1)
job_need = re.findall(re.compile(r'<p class="msg
ltype".*?>
.*? <span>|</span>
(.*?) <span>|</span>
(.*?)
<span>|</span> .*?</p>',re.S),res1)
welfare = re.findall(re.compile(r'
<span class="sp4">
(.*?)
</span>',re.S),res1)
print(i[0],i[2],i[4],i[5],company[0][0],
job_need[2][0],
job_need[1][0],company[0][1],company[0][2],
welfare,i[6])
sheet1.write(number,0,number)
sheet1.write(number,1,i[0])
sheet1.write(number,2,i[2])
sheet1.write(number,3,i[4])
sheet1.write(number,4,company[0][0])
sheet1.write(number,5,i[5])
sheet1.write(number,6,job_need[1][0])
sheet1.write(number,7,job_need[2][0])
sheet1.write(number,8,company[0][1])
sheet1.write(number,9,company[0][2])
sheet1.write(number,10,(" ".join(str(i)
for
i in welfare)))
sheet1.write(number,11,i[6])
number+=1
excel1.save("51job.xls")
time.sleep(0.3) #анЯЂМфИєЃЌБмУтХРШЁКЃСПЪ§Он
ЪББЛЮѓХаЮЊЙЅЛїЃЌIPдтЕНЗтНћ
except:
pass
except:
pass
|
НсЙћШчЯТЃК
2.Ъ§ОнЧхЯД
ЪзЯШвЊДђПЊЮФМў
#coding:utf-8
import pandas as pd
import re
#Г§ДЫжЎЭтЛЙвЊАВзАxlrdАќ
data = pd.read_excel(r'51job.xls',sheet_name='Job')
result = pd.DataFrame(data) |
ЧхЯДЫМТЗЃК
1ЁЂГіЯжгаПежЕЃЈNANЃЉЕУаХЯЂЃЌжБНгЩОГ§ећаа
a = result.dropna(axis=0,how='any')
pd.set_option('display.max_rows',None) #ЪфГіШЋВПааЃЌВЛЪЁТд |
2ЁЂжАЮЛГіДэЃЈКмЖржАЮЛЖМЪЧгыДѓЪ§ОнЮоЙиЕФжАвЕЃЉ
b = u'Ъ§Он'
number = 1
li = a['жАЮЛ']
for i in range(0,len(li)):
try:
if b in li[i]:
#print(number,li[i])
number+=1
else:
a = a.drop(i,axis=0)
except:
pass |
3ЁЂЦфЫћЕиЗНГіЯжЕФаХЯЂДэЮЛЃЌБШШчдкбЇРњРяГіЯж ЁЎеаЖрЩйШЫЁЏ
b2= u'ШЫ'
li2 = a['бЇРњвЊЧѓ']
for i in range(0,len(li2)):
try:
if b2 in li2[i]:
#print(number,li2[i])
number+=1
a = a.drop(i,axis=0)
except:
pass |
4ЁЂзЊЛЛаНзЪЕЅЮЛ
ШчЩЯЭМОЭГіЯжЕЅЮЛВЛвЛжТЕФЧщПі
b3 =u'Эђ/Фъ'
b4 =u'ЧЇ/дТ'
li3 = a['аНзЪ']
#зЂЪЭВПЗжЕФprintЖМЪЧЮЊСЫЕїЪдгУЕФ
for i in range(0,len(li3)):
try:
if b3 in li3[i]:
x = re.findall(r'\d*\.?\d+',li3[i])
#print(x)
min_ = format(float(x[0])/12,'.2f') #зЊЛЛГЩИЁЕуаЭВЂБЃСєСНЮЛаЁЪ§
max_ = format(float(x[1])/12,'.2f')
li3[i][1] = min_+'-'+max_+u'Эђ/дТ'
if b4 in li3[i]:
x = re.findall(r'\d*\.?\d+',li3[i])
#print(x)
#input()
min_ = format(float(x[0])/10,'.2f')
max_ = format(float(x[1])/10,'.2f')
li3[i][1] = str(min_+'-'+max_+'Эђ/дТ')
print(i,li3[i])
except:
pass |
БЃДцЕНСэвЛИіExcelЮФМў
| a.to_excel('51job2.xls',
sheet_name='Job', index=False) |
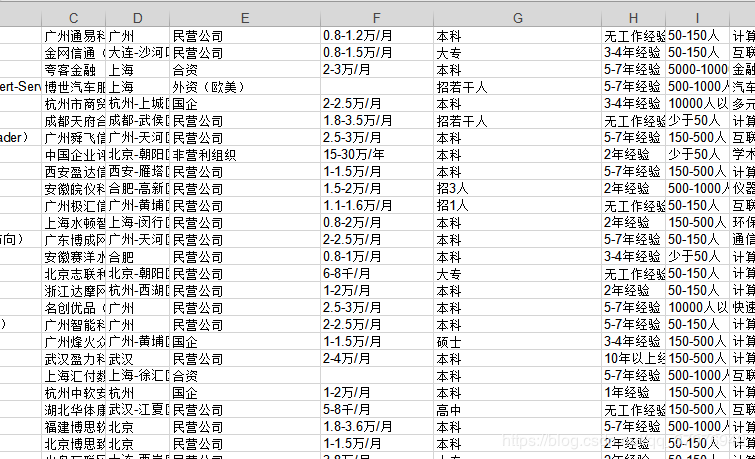
етРяжЛЪЧМђЕЅЕФНщЩмСЫвЛаЉЪ§ОнЧхРэЕФЫМТЗЃЌВЂВЛЪЧЫЕжЛвЊЧхРэетаЉОЭааСЫ
гаЪБКђгаЕФЙЋЫОЭјвГВЂВЛЪЧЧАГЬЮогЧРраЭЕФЃЌЖјЪЧЫћУЧЙЋЫОздМКзіЕФЭјвГЃЌетвВКмШнвзГіДэ
ВЛЙ§жЛвЊгаСЫЛљБОЫМТЗЃЌетаЉЖМВЛФбЧхРэ
3.Ъ§ОнПЩЪгЛЏ
Ъ§ОнПЩЪгЛЏПЩвдЫЕЪЧКмживЊЕФЛЗНкЃЌШчЙћжЛЪЧХРШЁЪ§ОнЖјВЛШЅПЩЪгЛЏДІРэЃЌФЧУДПЩвдЫЕЪ§ОнЕФМлжЕИљБОУЛгаЗЂЛг
ПЩЪгЛЏДІРэФмЪЙЪ§ОнИќМгжБЙлЃЌИќгаРћгкЗжЮі
ЩѕжСПЩвдЫЕПЩЪгЛЏЪЧЪ§ОнЭкОђзюживЊЕФФкШн
ЭЌбљЕФЮвУЧЯШПДДњТыашвЊЕФАќ
# -*- coding:
utf-8 -*-
import pandas as pd
import re
from pyecharts import Funnel,Pie,Geo
import matplotlib.pyplot as plt |
етРяЬиБ№ЧПЕїЃЌpyechartsАќЧЇЭђБ№зАаТАцЕФЃЌЮветРязАЕФЪЧ0.5.9АцЕФ
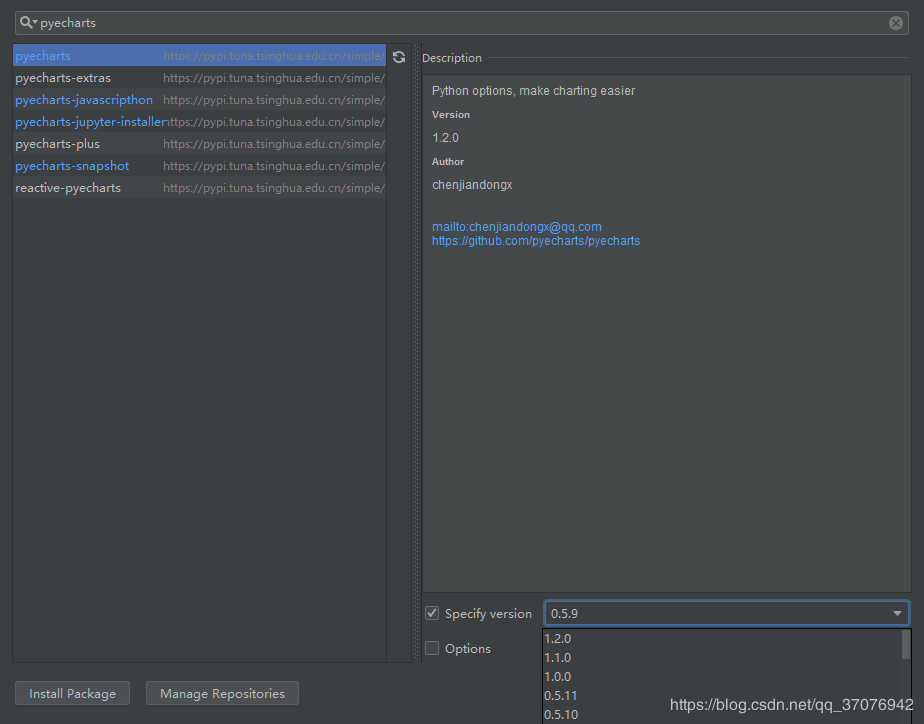
ЦфДЮШчЙћвЊзіЕиРэзјБъЭМЃЌШШСІЭМЩЖЕФЃЌБиаыАВзАЕиЭМАќЃЌБШШчЪРНчЕиЭМАќЃЌжаЙњЕиЭМАќЃЌГЧЪаЕиЭМАќЩЖЕФ
НгЯТРДОЭЪЧе§ЯЗ
вЛбљЕФЯШвЊДђПЊЮФМў
file = pd.read_excel(r'51job2.xls',sheet_name='Job')
f = pd.DataFrame(file)
pd.set_option('display.max_rows',None) |
1ЁЂДДНЈЖрИіСаБэРДЕЅЖРДцЗХЁОЁЎаНзЪЁЏЁПЁОЁЎЙЄзїОбщЁЏЁПЁОЁЎбЇРњвЊЧѓЁЏЁПЁОЁЎЙЋЫОЕиЕуЁЏЁПЕШаХЯЂ
add = f['ЙЋЫОЕиЕу']
sly = f['аНзЪ']
edu = f['бЇРњвЊЧѓ']
exp = f['ЙЄзїОбщ']
address =[]
salary = []
education = []
experience = []
for i in range(0,len(f)):
try:
a = add[i].split('-')
address.append(a[0])
#print(address[i])
s = re.findall(r'\d*\.?\d+',sly[i])
s1= float(s[0])
s2 =float(s[1])
salary.append([s1,s2])
#print(salary[i])
education.append(edu[i])
#print(education[i])
experience.append(exp[i])
#print(experience[i])
except:
pass |
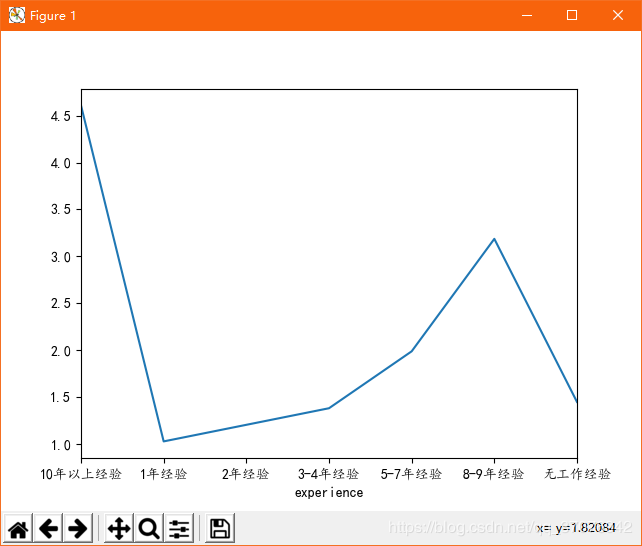
2ЁЂmatploblibПтЩњГЩ ЙЄзїОбщЁЊаНзЪЭМ гы бЇРњЁЊаНзЪЭМ
min_s=[] #ЖЈвхДцЗХзюЕЭаНзЪЕФСаБэ
max_s=[] #ЖЈвхДцЗХзюИпаНзЪЕФСаБэ
for i in range(0,len(experience)):
min_s.append(salary[i][0])
max_s.append(salary[i][0])
my_df = pd.DataFrame({'experience':experience,
'min_salay' : min_s, 'max_salay' : max_s})
#ЙиСЊЙЄзїОбщгыаНзЪ
data1 = my_df.groupby('experience').mean()['min_salay']
.plot(kind='line')
plt.show()
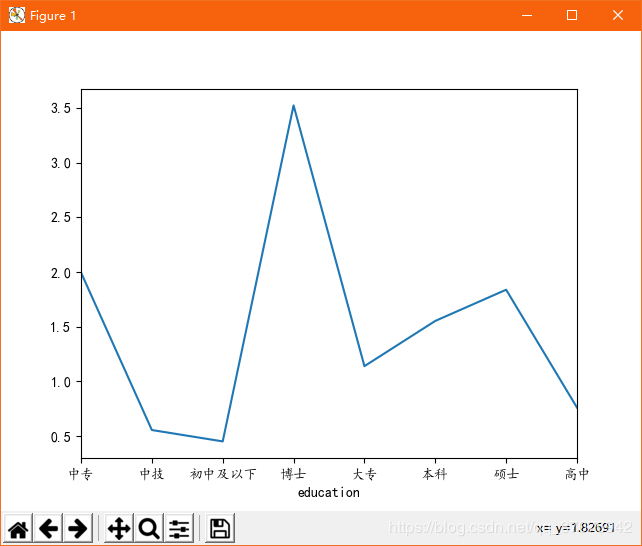
my_df2 = pd.DataFrame({'education':education,
'min_salay' : min_s, 'max_salay' : max_s})
#ЙиСЊбЇРњгыаНзЪ
data2 = my_df2.groupby('education').mean()['min_salay'].
plot(kind='line')
plt.show() |
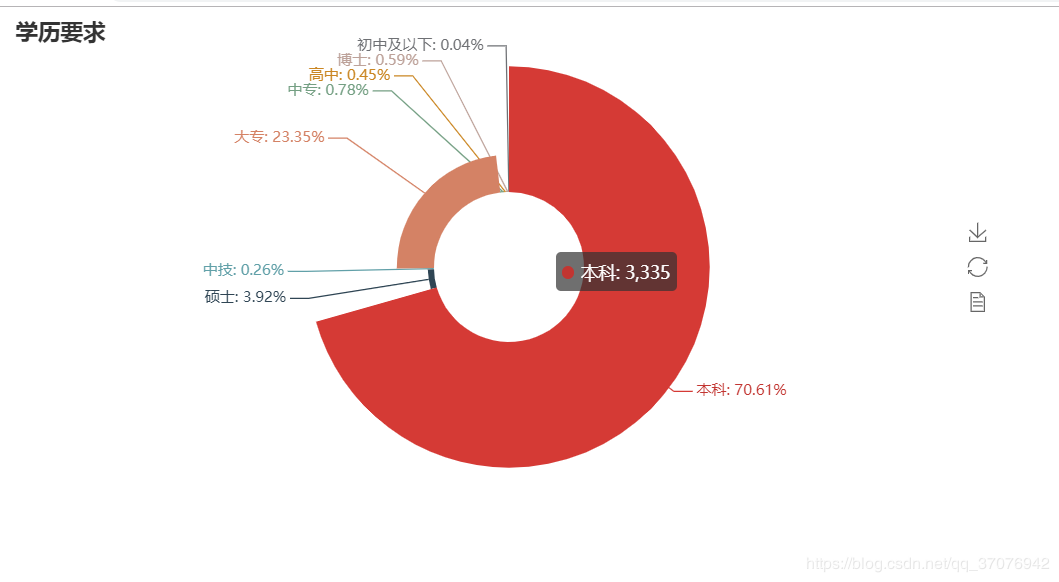
3ЁЂбЇРњвЊЧѓдВЛЗЭМ
def get_edu(list):
education2 = {}
for i in set(list):
education2[i] = list.count(i)
return education2
dir1 = get_edu(education)
# print(dir1)
attr= dir1.keys()
value = dir1.values()
pie = Pie("бЇРњвЊЧѓ")
pie.add("", attr, value, center=[50,
50], is_random=False, radius=[30, 75], rosetype='radius',
is_legend_show=False, is_label_show=True,legend_orient='vertical')
pie.render('бЇРњвЊЧѓУЕЙхЭМ.html') |
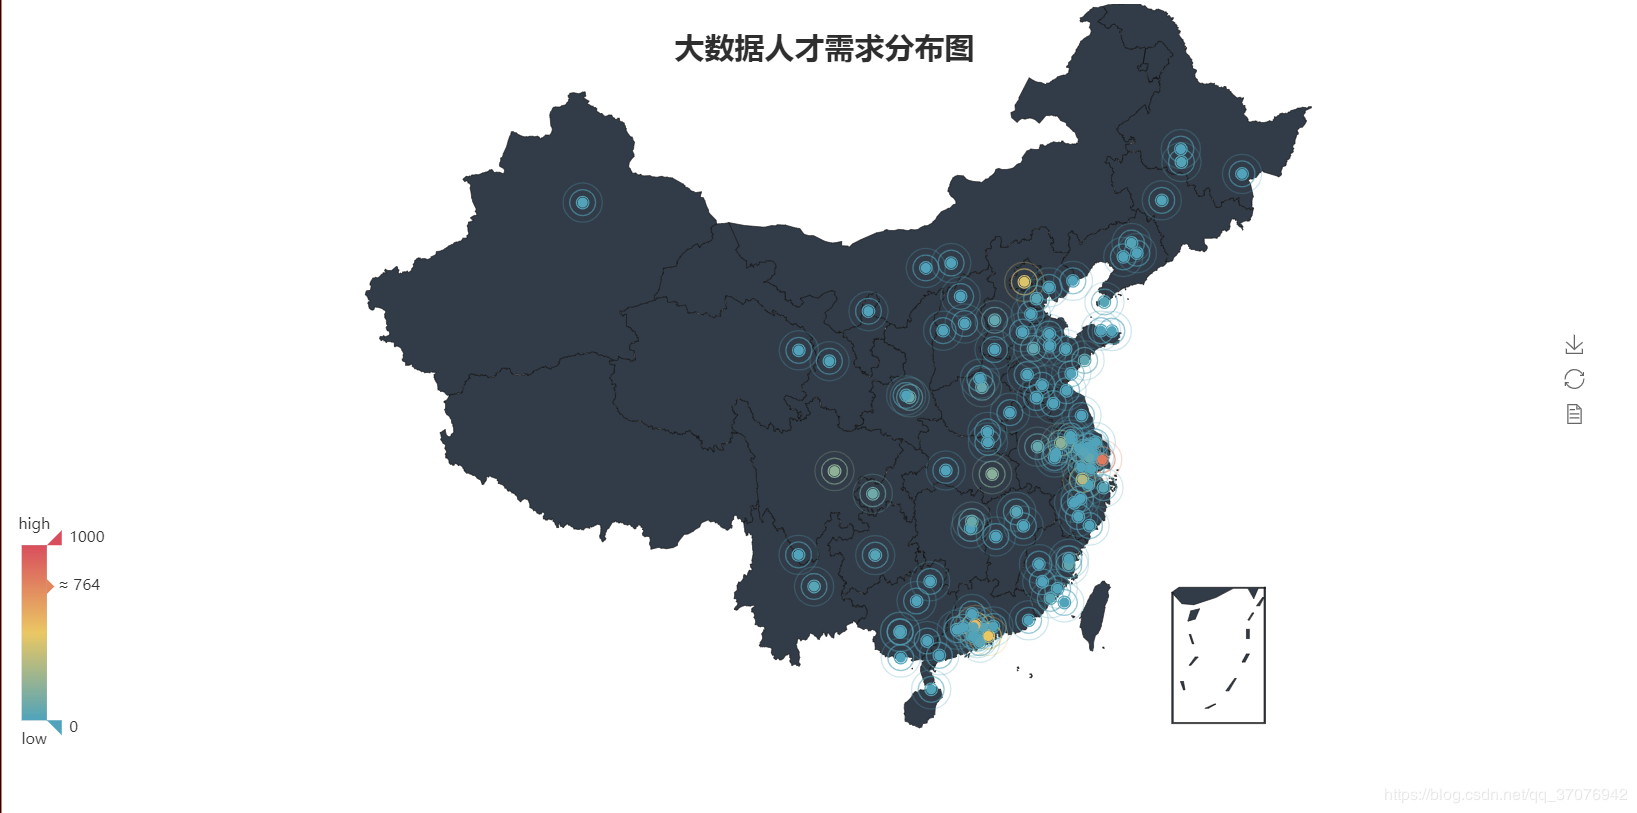
4ЁЂДѓЪ§ОнГЧЪаашЧѓЕиРэЮЛжУЗжВМЭМ
def get_address(list):
address2 = {}
for i in set(list):
address2[i] = list.count(i)
address2.pop('вьЕиеаЦИ')
# гааЉЕиУћПЩФмВЛКЯЗЈЛђепЕиЭМАќРяУЛгаПЩвдздааЩОГ§ЃЌжЎЧАвдЯТУћГЦЖМЛсБЈДэЃЌЯждкКУЯёИќаТСЫ
#address2.pop('ЩНЖЋ')
#address2.pop('ХН')
#address2.pop('Гижн')
return address2
dir2 = get_address(address)
#print(dir2)
geo = Geo("ДѓЪ§ОнШЫВХашЧѓЗжВМЭМ", title_color="#2E2E2E",
title_text_size=24,title_top=20,title_pos="center",
width=1300,height=600)
attr2 = dir2.keys()
value2 = dir2.values()
geo.add("",attr2, value2, type="effectScatter",
is_random=True, visual_range=[0, 1000], maptype='china',symbol_size=8,
effect_scale=5, is_visualmap=True)
geo.render('ДѓЪ§ОнГЧЪаашЧѓЗжВМЭМ.html') |
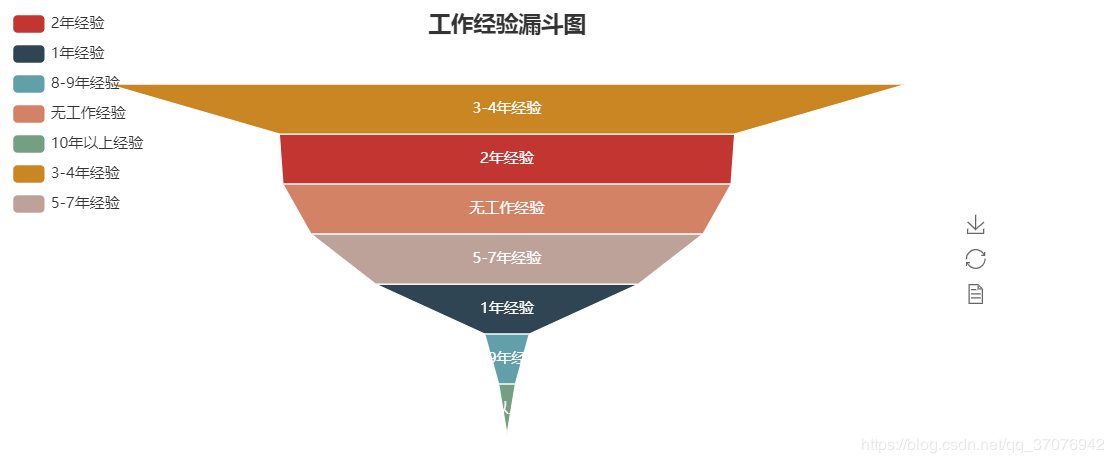
5ЁЂЙЄзїОбщвЊЧѓТЉЖЗЭМ
def get_experience(list):
experience2 = {}
for i in set(list):
experience2[i] = list.count(i)
return experience2
dir3 = get_experience(experience)
#print(dir3)
attr3= dir3.keys()
value3 = dir3.values()
funnel = Funnel("ЙЄзїОбщТЉЖЗЭМ",title_pos='center')
funnel.add("", attr3, value3,is_label_show=True,
label_pos="inside",
label_text_color="#fff",legend_orient='vertical',
legend_pos='left')
funnel.render('ЙЄзїОбщвЊЧѓТЉЖЗЭМ.html') |
ЕБШЛЃЌpyechartsРяУцЕФЭМЛЙгаКмЖржжЃЌОЭППДѓМвШЅздМКЗЂОђСЫЁЃ
ЗДРЁ
НгЕНВПЗжШЫЗДгІЕФТвТыЧщПіЃЌжївЊПЩФмЪЧвђЮЊЭјеОЙцдђБфЖЏЁЃЮвШЅжиаТИќаТСЫвЛЯТДњТыЃЌВЂЧвИФНјСЫвЛаЉЕиЗНЃЌШчЙћгіЕНХРШЁЙ§ГЬжаЭОЭЃЯТЕФЧщПіЃЌПЩФмЪЧЭјТчЮЪЬтЛђепЯнШызшШћЃЌПЩвджиаТдЫаавЛДЮДњТы
ЫљгаДњТыШчЯТЃК
# -*- coding:utf-8
-*-
import urllib.request
import xlwt
import re
import urllib.parse
import time
header={
'Host':'search.51job.com',
'Upgrade-Insecure-Requests':'1',
'User-Agent':'Mozilla/5.0 (Windows NT 10.0;
Win64;
x64) >AppleWebKit/537.36 (KHTML,
like Gecko)
Chrome/78.0.3904.108
Safari/537.36'
}
def getfront(page,item): #pageЪЧвГЪ§ЃЌitemЪЧЪфШы
ЕФзжЗћДЎ
result = urllib.parse.quote(item) #ЯШАбзжЗћДЎ
зЊГЩЪЎСљНјжЦБрТы
ur1 = result+',2,'+ str(page)+'.html'
ur2 = 'https://search.51job.com/list/000000,
000000,0000,00,9,99,'
res = ur2+ur1 #ЦДНгЭјжЗ
a = urllib.request.urlopen(res)
html = a.read().decode('gbk') # ЖСШЁдДДњТы
ВЂзЊЮЊunicode
return html
def getInformation(html):
reg = re.compile(r'class="t1 ">.*?
<a target="_blank"
title="(.*?)"
href="(.*?)".*? <span class="t2">
<a
target="_blank"
title="(.*?)"
href="(.*?)".*?<span class="t3">
(.*?)</span>.
*?<span
class="t4">(.*?)</span>.*?<span
class="t5">(.*?)</span>.*?'
,re.S)#ЦЅХфЛЛааЗћ
items=re.findall(reg,html)
return items
#аТНЈБэИёПеМф
excel1 = xlwt.Workbook()
# ЩшжУЕЅдЊИёИёЪН
sheet1 = excel1.add_sheet('Job',
cell_overwrite_ok=True)
sheet1.write(0, 0, 'ађКХ')
sheet1.write(0, 1, 'жАЮЛ')
sheet1.write(0, 2, 'ЙЋЫОУћГЦ')
sheet1.write(0, 3, 'ЙЋЫОЕиЕу')
sheet1.write(0, 4, 'ЙЋЫОаджЪ')
sheet1.write(0, 5, 'аНзЪ')
sheet1.write(0, 6, 'бЇРњвЊЧѓ')
sheet1.write(0, 7, 'ЙЄзїОбщ')
sheet1.write(0, 8, 'ЙЋЫОЙцФЃ')
sheet1.write(0, 9, 'ЙЋЫОРраЭ')
sheet1.write(0, 10,'ЙЋЫОИЃРћ')
sheet1.write(0, 11,'ЗЂВМЪБМф')
number = 1
item = input()
for j in range(1,10000): #вГЪ§здМКЫцБуИФ
try:
print("е§дкХРШЁЕк"+str(j)+"вГЪ§Он...")
html = getfront(j,item) #ЕїгУЛёШЁЭјвГдТы
for i in getInformation(html):
try:
url1 = i[1] #жАЮЛЭјжЗ
res1 = urllib.request.urlopen(url1).read().
decode('gbk')
company = re.findall(re.compile(r'<div class=
"com_tag">
.*?<p
class="at" title="(.*?)"><span
class="i_flag"
>.*?
<p class="at"
title="(.*?)">.*?<p class="at"
title="(.*?)">
.*?',re.S),res1)
job_need = re.findall(re.compile(r'<p class=
"msg
ltype".*?>
.*? <span>|</span>
(.*?) <span>|</span>
(.*?) <span>|</span>
.*?</p>',re.S),res1)
welfare = re.findall(re.compile(r'<span class="sp4">(.*?)</span>',re.S),res1)
print(i[0],i[2],i[4],i[5],company[0][0],
job_need[2][0],job_need[1][0],company[0][1],
company[0][2],welfare,i[6])
sheet1.write(number,0,number)
sheet1.write(number,1,i[0])
sheet1.write(number,2,i[2])
sheet1.write(number,3,i[4])
sheet1.write(number,4,company[0][0])
sheet1.write(number,5,i[5])
sheet1.write(number,6,job_need[2][0])
sheet1.write(number,7,job_need[1][0])
sheet1.write(number,8,company[0][1])
sheet1.write(number,9,company[0][2])
sheet1.write(number,10,(" ".join(str(i)
for i in welfare)))
sheet1.write(number,11,i[6])
number+=1
excel1.save("51job.xls")
time.sleep(0.3) #анЯЂМфИєЃЌБмУтХРШЁ
КЃСПЪ§ОнЪББЛЮѓХаЮЊЙЅЛїЃЌIPдтЕНЗтНћ
except:
pass
except:
pass
|
#coding:utf-8
import pandas as pd
import re
data = pd.read_excel(r'51job.xls',sheet_name='Job')
result = pd.DataFrame(data)
a = result.dropna(axis=0,how='any')
pd.set_option('display.max_rows',None)
#ЪфГіШЋВПааЃЌВЛЪЁТд
b = u'Ъ§Он'
number = 1
li = a['жАЮЛ']
for i in range(0,len(li)):
try:
if b in li[i]:
#print(number,li[i])
number+=1
else:
a = a.drop(i,axis=0) #ЩОГ§ећаа
except:
pass
b2 = 'ШЫ'
li2 = a['бЇРњвЊЧѓ']
for i in range(0,len(li2)):
try:
if b2 in li2[i]:
# print(number,li2[i])
number += 1
a = a.drop(i, axis=0)
except:
pass
b3 =u'Эђ/Фъ'
b4 =u'ЧЇ/дТ'
li3 = a['аНзЪ']
#зЂЪЭВПЗжЕФprintЖМЪЧЮЊСЫЕїЪдгУЕФ
for i in range(0,len(li3)):
try:
if b3 in li3[i]:
x = re.findall(r'\d*\.?\d+',li3[i])
#print(x)
min_ = format(float(x[0])/12,'.2f')
#зЊЛЛГЩИЁЕуаЭВЂБЃСєСНЮЛаЁЪ§
max_ = format(float(x[1])/12,'.2f')
li3[i][1] = min_+'-'+max_+u'Эђ/дТ'
if b4 in li3[i]:
x = re.findall(r'\d*\.?\d+',li3[i])
#print(x)
#input()
min_ = format(float(x[0])/10,'.2f')
max_ = format(float(x[1])/10,'.2f')
li3[i][1] = str(min_+'-'+max_+'Эђ/дТ')
print(i,li3[i])
except:
pass
a.to_excel('51job2.xls', sheet_name='Job', index=False)
import pandas as pd
import re
from pyecharts import Funnel,Pie,Geo
import matplotlib.pyplot as plt
file = pd.read_excel(r'51job2.xls',sheet_name='Job')
f = pd.DataFrame(file)
pd.set_option('display.max_rows',None)
add = f['ЙЋЫОЕиЕу']
sly = f['аНзЪ']
edu = f['бЇРњвЊЧѓ']
exp = f['ЙЄзїОбщ']
address =[]
salary = []
education = []
experience = []
for i in range(0,len(f)):
try:
a = add[i].split('-')
address.append(a[0])
#print(address[i])
s = re.findall(r'\d*\.?\d+',sly[i])
s1= float(s[0])
s2 =float(s[1])
salary.append([s1,s2])
#print(salary[i])
education.append(edu[i])
#print(education[i])
experience.append(exp[i])
#print(experience[i])
except:
pass
min_s=[] #ЖЈвхДцЗХзюЕЭаНзЪЕФСаБэ
max_s=[] #ЖЈвхДцЗХзюИпаНзЪЕФСаБэ
for i in range(0,len(experience)):
min_s.append(salary[i][0])
max_s.append(salary[i][0])
#matplotlibФЃПщШчЙћЯдЪОВЛСЫжаЮФзжЗћДЎПЩвдгУвдЯТДњТыЁЃ
plt.rcParams['font.sans-serif'] = ['KaiTi'] #
жИЖЈФЌШЯзжЬх
plt.rcParams['axes.unicode_minus'] = False
# НтОіБЃДцЭМЯёЪЧИККХ'-'ЯдЪОЮЊЗНПщЕФЮЪЬт
my_df = pd.DataFrame({'experience':experience,
'min_salay' : min_s, 'max_salay' : max_s})
#ЙиСЊЙЄзїОбщгыаНзЪ
data1 = my_df.groupby('experience').mean()
['min_salay'].plot(kind='line')
plt.show()
my_df2 = pd.DataFrame({'education':education,
'min_salay' : min_s, 'max_salay' : max_s})
#ЙиСЊбЇРњгыаНзЪ
data2 = my_df2.groupby('education').mean()
['min_salay'].plot(kind='line')
plt.show()
def get_edu(list):
education2 = {}
for i in set(list):
education2[i] = list.count(i)
return education2
dir1 = get_edu(education)
# print(dir1)
attr= dir1.keys()
value = dir1.values()
pie = Pie("бЇРњвЊЧѓ")
pie.add("", attr, value, center=[50,
50],
is_random=False, radius=[30, 75], rosetype='radius',
is_legend_show=False, is_label_show=True,
legend_orient='vertical')
pie.render('бЇРњвЊЧѓУЕЙхЭМ.html')
def get_address(list):
address2 = {}
for i in set(list):
address2[i] = list.count(i)
address2.pop('вьЕиеаЦИ')
# гааЉЕиУћПЩФмВЛКЯЗЈЛђепЕиЭМАќРяУЛгаПЩвдздааЩОГ§ЃЌ
жЎЧАвдЯТУћГЦЖМЛсБЈДэЃЌЯждкКУЯёИќаТСЫ
#address2.pop('ЩНЖЋ')
#address2.pop('ХН')
#address2.pop('Гижн')
return address2
dir2 = get_address(address)
#print(dir2)
geo = Geo("ДѓЪ§ОнШЫВХашЧѓЗжВМЭМ", title_color="#2E2E2E",
title_text_size=24,title_top=20,title_pos="center",
width=1300,height=600)
attr2 = dir2.keys()
value2 = dir2.values()
geo.add("",attr2, value2, type="effectScatter",
is_random=True, visual_range=[0, 1000], maptype='china',
symbol_size=8,
effect_scale=5, is_visualmap=True)
geo.render('ДѓЪ§ОнГЧЪаашЧѓЗжВМЭМ.html')
def get_experience(list):
experience2 = {}
for i in set(list):
experience2[i] = list.count(i)
return experience2
dir3 = get_experience(experience)
#print(dir3)
attr3= dir3.keys()
value3 = dir3.values()
funnel = Funnel("ЙЄзїОбщТЉЖЗЭМ",title_pos='center')
funnel.add("", attr3, value3,is_label_show=True,
label_pos="inside",
label_text_color="#fff",legend_orient='vertical',
legend_pos='left')
funnel.render('ЙЄзїОбщвЊЧѓТЉЖЗЭМ.html')
|
HTMLЮФМўзюКУгУЙШИшфЏРРЦїДђПЊЃЌШчЙћЕуПЊУЛЗДгІПЩвддкЮФМўМаРяевЕНИУЮФМўШЛКѓДђПЊ

|