| БрМЭЦМі: |
| БОЮФРДздгк51cto,ЮФеТжївЊНщЩмШчКЮЕМШыЭМЯёВЂЙлВьЦфЪєадЁЂВ№ЗжЭМВувдМАВщПДЛвЖШЃЌЯЃЭћЖдДѓМвЕФбЇЯАФмгаЫљАяжњЁЃ |
|
БОНЬГЬНЋНщЩмШчКЮЕМШыЭМЯёВЂЙлВьЦфЪєадЁЂВ№ЗжЭМВувдМАВщПДЛвЖШЁЃдке§ЪНПЊЪМжЎЧАЃЌЮвУЧЯШРДСЫНтвЛаЉЙигкЯёЫиЕФЛљДЁжЊЪЖЁЃ
МЦЫуЛњНЋЭМЦЌвдЯёЫиаЮЪНДцДЂЃЌетОЭЯёТэШќПЫвЛбљЁЃШчЙћЯёЫиЬЋДѓЃЌКмФбжЦзїЙтЛЌЕФБпдЕКЭЧњЯпЁЃЯрЗДЃЌЮвУЧЪЙгУЕФЯёЫидНЖрдНаЁЃЌПДЦ№РДОЭЛсдНЦНЛЌЃЌЛђепЫЕЯёЫиЛЏГЬЖШдНаЁЃЌЭМЯёОЭЛсдНКУПДЃЌгаЪБЃЌетвВБЛГЦЮЊЭМЯёЗжБцТЪЁЃ
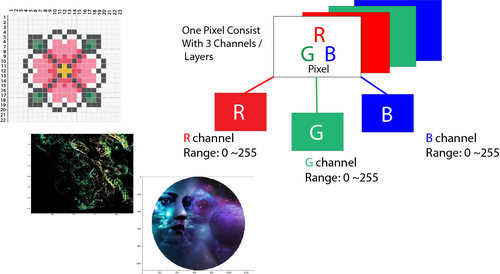
ЪИСПЭМаЮЪЧвЛжжгаЕуВЛЭЌЕФДцДЂЭМЯёЗНЗЈЃЌжМдкБмУтгыЯёЫиЯрЙиЕФЮЪЬтЁЃЕЋЪЧЃЌМДЪЙЪЧЪИСПЭМЯёЃЌзюжевВЛсЯдЪОЮЊЯёЫивЛбљЕФТэШќПЫЁЃбеЩЋЯёЫиБэЪОЭМЯёдЊЫиЃЌУшЪіУПИіЯёЫиЕФМђЕЅЗНЗЈЪЧЪЙгУШ§жжбеЩЋЕФзщКЯЃЌМДКьЩЋЃЌТЬЩЋЃЌРЖЩЋЃЌетОЭЪЧЮвУЧЫљЫЕЕФRGBЭМЯёЁЃ
дкRGBЭМЯёжаЃЌУПИіЯёЫиЗжБ№гыКьЩЋЃЌТЬЩЋЃЌРЖЩЋЕФжЕЯрЙиСЊЕФШ§Иі8БШЬиЪ§зжБэЪОЁЃзюКѓЃЌШчЙћЪЙгУЗХДѓОЕЙлВьЫѕЗХЕФЭМЦЌЃЌЮвУЧЛсПДЕНЭМЦЌгЩЮЂаЁЕФЙтЕуЛђИќОпЬхЕФЯёЫизщГЩЃЌИќгаШЄЕФЪЧетаЉаЁЙтЕуЪЕМЪЩЯОпгаЖрИіВЛЭЌбеЩЋЁЃ
УПеХееЦЌЖМвдЪ§зжаЮЪНгЩЯёЫизщГЩЃЌЫќУЧЪЧЙЙГЩЭМЦЌЕФзюаЁаХЯЂЕЅЮЛЃЌЭЈГЃЪЧдВаЮЛђЗНаЮЃЌЫќУЧЭЈГЃВМжУдкЖўЮЌЭјИёжаЁЃ
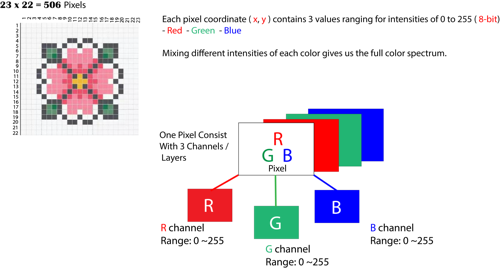
ШчЙћШ§ИібеЩЋЖМДІгкзюДѓжЕЃЌдђвтЮЖзХЫќУЧЪЧ255ЃЌФЧОЭЛсЯдЪОЮЊАзЩЋЃЌШчЙћШ§жжбеЩЋЖМДІгкзюаЁжЕЃЌЛђепжЕЮЊ0ЃЌдђбеЩЋЯдЪОЮЊКкЩЋЁЃЗДЙ§РДЃЌетШ§епЕФзщКЯНЋЮЊЮвУЧЬсЙЉЬиЖЈЕФЯёЫибеЩЋЁЃгЩгкУПИібеЩЋЪ§зжЖМЪЧ8ИіБШЬиЃЌвђДЫжЕЗЖЮЇЮЊ0-255ЁЃ
гЩгкУПИіжЕПЩвдОпга256ИіВЛЭЌЕФЧПЖШЛђССЖШжЕЃЌвђДЫШ§жжбеЩЋзмЙВга1680ЭђИіshadeЁЃ
вдЯТЪЧNumpyandЗЧГЃЛљБОЕФЭМЯёЪ§ОнЗжЮіВНжшЃЌЦфжавЛаЉЩцМАPython pacakgesЃЌШчimageioЃЌmatplotlibЕШЁЃ
ЕМШыЭМЯёВЂЙлВьЦфЪєад
В№ЗжЭМВу
Greyscale
ЖдЯёЫижЕЪЙгУТпМдЫЫуЗћ
ЪЙгУТпМдЫЫуЗћНјаадЫЫу
ЮРаЧЭМЯёЪ§ОнЗжЮі
ЕМШыЭМЯё
ЯждкШУЮвУЧМгдиЭМЯёВЂЙлВьИїжжЪєадЃК
if __name__
== '__main__':
import imageio
import matplotlib.pyplot as plt
%matplotlib inline
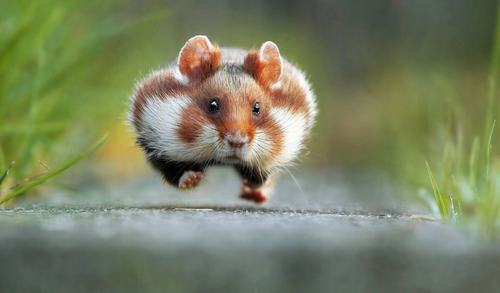
pic = imageio.imread('F:/demo_2.jpg')
plt.figure(figsize = (15,15))
plt.imshow(pic)ЙлВьЭМЯёЕФЛљБОЪєад
print('Type of the image : ' , type(pic))
print('Shape of the image : {}'.format(pic.shape))
print('Image Hight {}'.format(pic.shape[0]))
print('Image Width {}'.format(pic.shape[1]))
print('Dimension of Image {}'.format(pic.ndim))
Type of the image :
Shape of the image : (562, 960, 3)
Image Hight 562
Image Width 960
Dimension of Image 3 |
ndarrayЕФаЮзДБэУїЫќЪЧвЛИіШ§ВуОиеѓЃЌетРяЕФЧАСНИіЪ§зжЪЧГЄЖШКЭПэЖШЃЌЕкШ§ИіЪ§зж(МД3)ЪЧШ§ВуЃКRed,
Green, BlueЁЃ вђДЫЃЌШчЙћЮвУЧМЦЫуRGBЭМЯёЕФДѓаЁЃЌдђзмДѓаЁНЋМЦЮЊheight x width
x 3
print('Image
size {}'.format(pic.size))
print('Maximum RGB value in this image {}'.format(pic.max()))
print('Minimum RGB value in this image {}'.format(pic.min()))
Image size 1618560
Maximum RGB value in this image 255
Minimum RGB value in this image 0 |
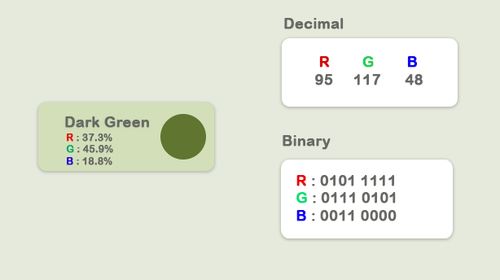
етаЉжЕЖдгкбщжЄКмживЊЃЌвђЮЊ8БШЬибеЩЋЧПЖШВЛФмГЌГі0ЕН255ЗЖЮЇЁЃ
ЯждкЃЌЪЙгУЭМЦЌЗжХфБфСПЃЌЮвУЧЛЙПЩвдЗУЮЪЭМЦЌЕФШЮКЮЬиЖЈЯёЫижЕЃЌВЂНјвЛВНЗУЮЪУПИіRGBЭЈЕРЁЃ
'''
Let's pick a specific pixel located at 100 th
Rows and 50 th Column.
And view the RGB value gradually.
'''
pic[ 100, 50 ]
Image([109, 143, 46], dtype=uint8) |
дкетжжЧщПіЯТЃКR = 109; G = 143; B = 46ЃЌЮвУЧПЩвдвтЪЖЕНетИіЬиЪтЯёЫижагаКмЖрТЬЩЋЁЃЯждкЃЌЮвУЧПЩвдЭЈЙ§ИјГіШ§ИіЭЈЕРЕФЫїв§жЕРДЬиБ№бЁдёЦфжавЛИіЪ§зжЃК
0КьЩЋЭЈЕРЕФЫїв§жЕ
1ТЬЩЋЭЈЕРЕФЫїв§жЕ
2РЖЩЋЭЈЕРЕФЫїв§жЕ
ЕЋЪЧЃЌдкOpenCVжаЃЌЭМЯёВЛЪЧRGBЖјЪЧBGRЃЌimageio.imreadНЋЭМЯёМгдиЮЊRGB(ЛђRGBA)ЃЌЕЋOpenCVМйЖЈЭМЯёЮЊBGRЛђBGRA(BGRЪЧФЌШЯЕФOpenCVбеЩЋИёЪН)ЁЃ
# A specific
pixel located at Row : 100 ; Column : 50
# Each channel's value of it, gradually R , G
, B
print('Value of only R channel {}'.format(pic[
100, 50, 0]))
print('Value of only G channel {}'.format(pic[
100, 50, 1]))
print('Value of only B channel {}'.format(pic[
100, 50, 2]))
Value of only R channel 109
Value of only G channel 143
Value of only B channel 46 |
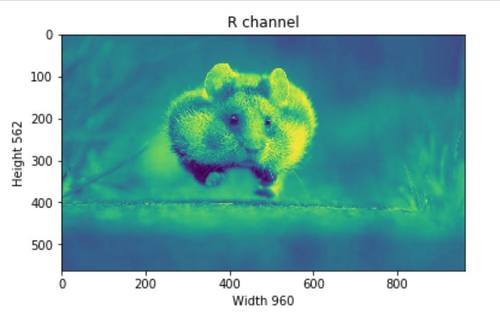
КУЕФЃЌЯждкШУЮвУЧПьЫйВщПДећИіЭМЯёжаЕФУПИіЦЕЕРЁЃ
plt.title('R
channel')
plt.ylabel('Height {}'.format(pic.shape[0]))
plt.xlabel('Width {}'.format(pic.shape[1]))
plt.imshow(pic[ : , : , 0])
plt.show() |
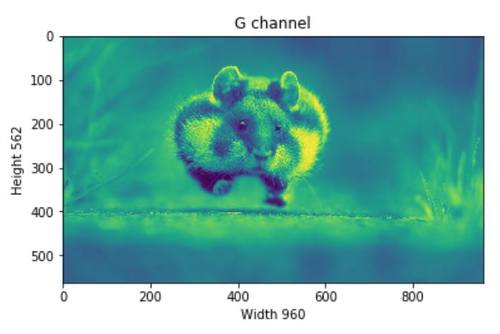
plt.title('G
channel')
plt.ylabel('Height {}'.format(pic.shape[0]))
plt.xlabel('Width {}'.format(pic.shape[1]))
plt.imshow(pic[ : , : , 1])
plt.show() |
plt.title('B
channel')
plt.ylabel('Height {}'.format(pic.shape[0]))
plt.xlabel('Width {}'.format(pic.shape[1]))
plt.imshow(pic[ : , : , 2])
plt.show() |
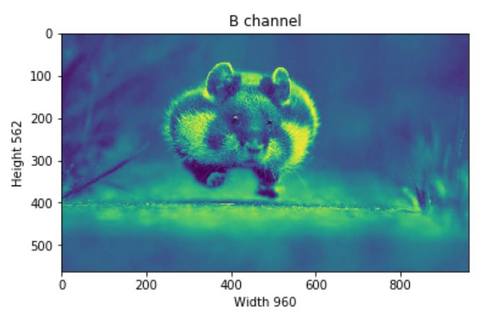
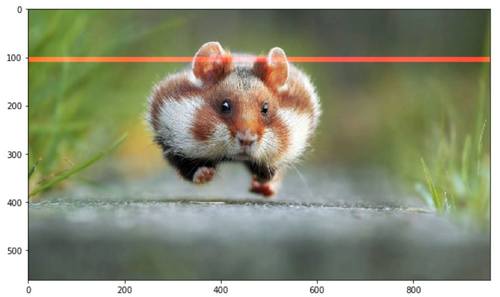
ЯждкЃЌЮвУЧПЩвдИќИФRGBжЕЕФЪ§СПЁЃР§ШчЃЌШУЮвУЧЖдКьЩЋЁЂТЬЩЋЁЂРЖЩЋЭМВуЩшжУИњЫцаажЕЕФЧПЖШЁЃ
RЦЕЕРЃКаа - 100ЕН110
GЦЕЕРЃКаа - 200ЕН210
BЦЕЕРЃКаа - 300ЕН310
ЮвУЧНЋМгдивЛДЮЭМЯёЃЌвдБуПЩвдЭЌЪБЯдЪОУПИіВуЕФБфЛЏЁЃ
pic = imageio.imread('F:/demo_2.jpg')
pic[50:150 , : , 0] = 255 # full intensity to
those pixel's R channel
plt.figure( figsize = (10,10))
plt.imshow(pic)
plt.show() |
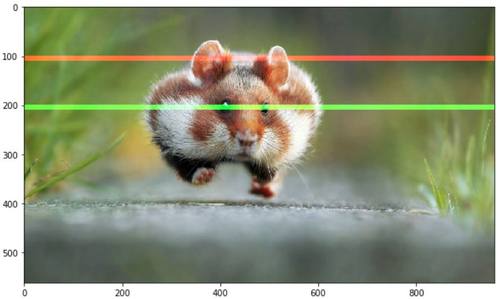
pic[200:300
, : , 1] = 255 # full intensity to those pixel's
G channel
plt.figure( figsize = (10,10))
plt.imshow(pic)
plt.show() |
pic[350:450
, : , 2] = 255 # full intensity to those pixel's
B channel
plt.figure( figsize = (10,10))
plt.imshow(pic)
plt.show() |

ЮЊСЫИќЧхГўЃЌШУЮвУЧвВИФБфСаВПЗжЃЌетДЮЮвУЧНЋЭЌЪБИќИФRGBЭЈЕРЁЃ
# set value
200 of all channels to those pixels which turns
them to white
pic[ 50:450 , 400:600 , [0,1,2] ] = 200
plt.figure( figsize = (10,10))
plt.imshow(pic)
plt.show() |

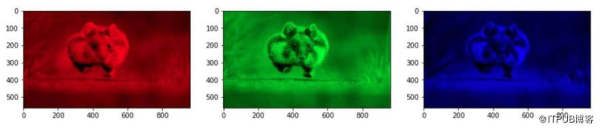
В№ЗжЭМВу
ЯждкЃЌЮвУЧжЊЕРЭМЯёЕФУПИіЯёЫиЖМгЩШ§ИіећЪ§БэЪОЃЌНЋЭМЯёЗжИюГЩЕЅЖРЕФбеЩЋЗжЦЌжЛашРГіЭМЯёеѓСаЕФе§ШЗЧаЦЌЁЃ
import numpy
as np
pic = imageio.imread('F:/demo_2.jpg')
fig, ax = plt.subplots(nrows = 1, ncols=3, figsize=(15,5))
for c, ax in zip(range(3), ax):
# create zero matrix
split_img = np.zeros(pic.shape, dtype="uint8")
# 'dtype' by default: 'numpy.float64'
# assing each channel
split_img[ :, :, c] = pic[ :, :, c]
# display each channel
ax.imshow(split_img) |
ЛвЖШ
КкАзЭМЯёДцДЂдкЖўЮЌеѓСажаЃЌгаСНжжРраЭЕФКкАзЭМЯёЃК
GreyscaleЃКЛвЩЋвѕгАЗЖЮЇЃК0~255
BinaryЃКЯёЫиЮЊКкЩЋЛђАзЩЋЃК0Лђ255
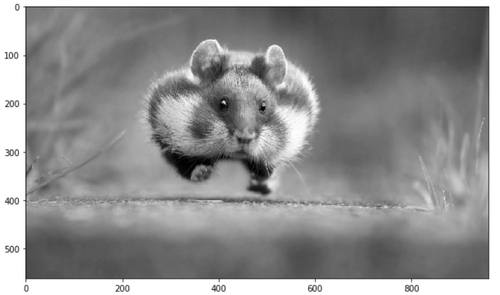
ЯждкЃЌGreyscalingЪЧвЛИіНЋЭМЯёДгШЋЩЋзЊЛЛЮЊЛвЩЋвѕгАЕФЙ§ГЬЁЃдкЭМЯёДІРэЙЄОпжаЃЌР§ШчЃКдкOpenCVжаЃЌаэЖрЙІФмдкДІРэжЎЧАЪЙгУЛвЖШЭМЯёЃЌетбљзіЪЧвђЮЊЫќМђЛЏСЫЭМЯёЃЌМИКѕПЩвдНЕдыВЂдіМгДІРэЪБМфЃЌвђЮЊЭМЯёжаЕФаХЯЂНЯЩйЁЃ
дкpythonжагаСНжжЗНЗЈПЩвдНЋЭМЯёзЊЛЛЮЊЛвЖШЃЌЕЋЪЙгУmatplotlibЕФМђЕЅЗНЗЈЪЧЪЙгУДЫЙЋЪНЛёШЁдЪМЭМЯёЕФRGBжЕЕФМгШЈЦНОљжЕЁЃ
Y' = 0.299 R
+ 0.587 G + 0.114 B
pic = imageio.imread('F:/demo_2.jpg')
gray = lambda rgb : np.dot(rgb[... , :3] , [0.299
, 0.587, 0.114])
gray = gray(pic)
plt.figure( figsize = (10,10))
plt.imshow(gray, cmap = plt.get_cmap(name = 'gray'))
plt.show() |
ШЛЖјЃЌGIMPНЋбеЩЋзЊЛЛЮЊЛвЖШЭМЯёШэМўгаШ§жжЫуЗЈРДЭъГЩШЮЮёЁЃ
ЛвЖШЕФLightness ЕШМЖМЦЫуЮЊ
| Lightness =
? ЁС (max(R,G,B) + min(R,G,B)) |
ЛвЖШЕФLuminosity ЕШМЖМЦЫуЮЊ
| Luminosity =
0.21 ЁС R + 0.72 ЁС G + 0.07 ЁС B |
ЛвЖШЕФAverage МЦЫуЮЊ
| Average Brightness
= (R + G + B) ЁТ 3 |
ШУЮвУЧГЂЪдвЛЯТЫуЗЈЃЌLuminosityаЇЙћШчКЮ?
pic = imageio.imread('F:/demo_2.jpg')
gray = lambda rgb : np.dot(rgb[... , :3] , [0.21
, 0.72, 0.07])
gray = gray(pic)
plt.figure( figsize = (10,10))
plt.imshow(gray, cmap = plt.get_cmap(name = 'gray'))
plt.show()
'''
Let's take a quick overview some the changed properties
now the color image.
Like we observe some properties of color image,
same statements are applying
now for gray scaled image.
'''
print('Type of the image : ' , type(gray))
print()
print('Shape of the image : {}'.format(gray.shape))
print('Image Hight {}'.format(gray.shape[0]))
print('Image Width {}'.format(gray.shape[1]))
print('Dimension of Image {}'.format(gray.ndim))
print()
print('Image size {}'.format(gray.size))
print('Maximum RGB value in this image {}'.format(gray.max()))
print('Minimum RGB value in this image {}'.format(gray.min()))
print('Random indexes [X,Y] : {}'.format(gray[100,
50]))
Type of the image :
Shape of the image : (562,960)
Image Height 562
Image Widht 960
Dimension of Image 2
Image size 539520
Maximum RGB value in this image 254.9999999997
Minimum RGB value in this image 0.0
Random indexes [X,Y] : 129.07 |
ЪЙгУТпМдЫЫуЗћДІРэЯёЫижЕ
ЮвУЧПЩвдЪЙгУТпМдЫЫуЗћДДНЈЯрЭЌДѓаЁЕФbullion ndarrayЁЃЕЋЪЧЃЌетВЛЛсДДНЈШЮКЮаТЪ§зщЃЌЫќжЛЪЧНЋжЕЗЕЛиЕНЦфжїБфСПЁЃР§ШчЃЌШчЙћПМТЧдкRGBЭМЯёжаТЫГ§вЛаЉЕЭжЕЯёЫиЛђИпжЕЛђ(ШЮКЮЬѕМў)ЃЌПЩвдЯШНЋRGBзЊЛЛЮЊЛвЖШЁЃ
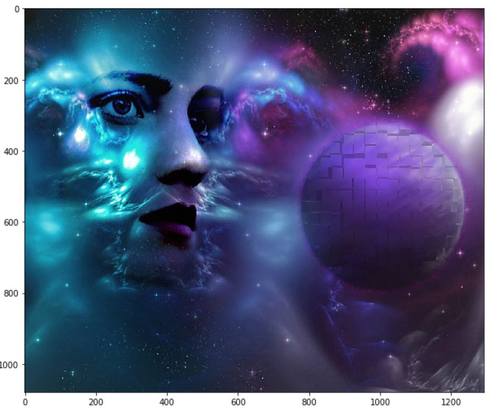
ЪзЯШМгдиЭМЯёВЂдкЦСФЛЩЯЯдЪОЃК
pic = imageio.imread('F:/demo_1.jpg')
plt.figure(figsize = (10,10))
plt.imshow(pic)
plt.show() |
НгЯТРДЃЌЮвУЧПМТЧзЊДЂИУЭМЯёЃЌБШШчЮвУЧЯывЊЙ§ТЫЫљгаЕЭгк20 ЕФЯёЫижЕЁЃЮЊДЫЃЌЮвУЧНЋЪЙгУТпМдЫЫуЗћжДааДЫШЮЮёЃЌЗЕЛиЫљгаЫїв§ЕФTrueжЕЁЃ
low_pixel =
pic < 20
# to ensure of it let's check if all values in
low_pixel are True or not
if low_pixel.any() == True:
print(low_pixel.shape)
(1079, 1293, 3) |
е§ШчЩЯЮФЫљЫЕЃЌДЋЭГЩЯВЛЪЙгУЫожїБфСПЃЌЕЋЮвжЎЫљвдЬсЕНЪЧвђЮЊЫќжЛБЃСєTrueжЕЁЃ ЫљвдЃЌШчЙћЮвУЧПДЕНlow_pixelКЭpicЕФ
shapeЃЌЮвУЧЛсЗЂЯжЫќУЧЖМОпгаЯрЭЌЕФ shapeЁЃ
print(pic.shape)
print(low_pixel.shape)
(1079, 1293, 3)
(1079, 1293, 3) |
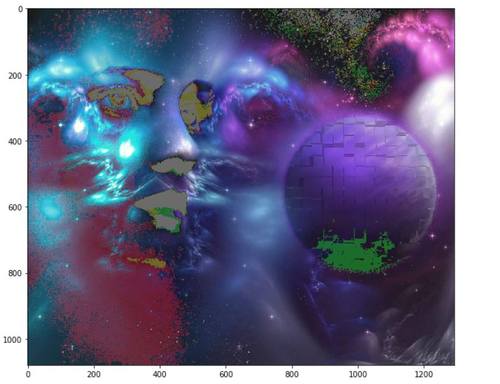
ЮвУЧЪЙгУШЋОжБШНЯдЫЫуЗћЮЊЫљгааЁгк200ЕФжЕЩњГЩЕЭжЕТЫВЈЦїЁЃЕЋЪЧЃЌЮвУЧПЩвдЪЙгУДЫlow_pixelЪ§зщзїЮЊЫїв§НЋетаЉЕЭжЕЩшжУЮЊФГаЉЬиЖЈжЕЃЌетаЉжЕПЩФмИпгкЛђЕЭгкЯШЧАЕФЯёЫижЕЁЃ
# randomly choose
a value
import random
# load the orginal image
pic = imageio.imread('F:/demo_1.jpg')
# set value randomly range from 25 to 225 - these
value also randomly choosen
pic[low_pixel] = random.randint(25,225)
# display the image
plt.figure( figsize = (10,10))
plt.imshow(pic)
plt.show() |
ЭМВуУЩАц
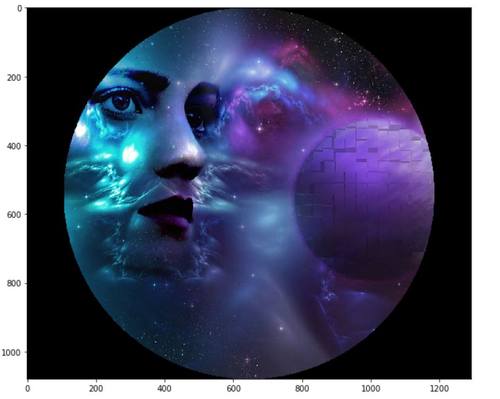
ЭМЯёУЩАцЪЧвЛжжЭМЯёДІРэММЪѕЃЌгУгкШЅГ§ОпгаФЃК§БпдЕЃЌЭИУїЛђЭЗЗЂВПЗжЕФееЦЌБГОАЁЃ
ЯждкЃЌЮвУЧНЋДДНЈвЛИідВХЬаЮзДЕФУЩАцЁЃЪзЯШЃЌЮвУЧНЋВтСПДгЭМЯёжааФЕНУПИіБпНчЯёЫижЕЕФОрРыЁЃЮвУЧЩшжУвЛИіБШНЯЗНБуЕФАыОЖжЕЃЌШЛКѓЪЙгУТпМдЫЫуЗћДДНЈвЛИідВХЬЃЌвдЯТЮЊДњТыЃК
if __name__
== '__main__':
# load the image
pic = imageio.imread('F:/demo_1.jpg')
# seperate the row and column values
total_row , total_col , layers = pic.shape
'''
Create vector.
Ogrid is a compact method of creating a multidimensional-
ndarray operations in single lines.
for ex:
>>> ogrid[0:5,0:5]
output: [array([[0],
[1],
[2],
[3],
[4]]),
array([[0, 1, 2, 3, 4]])]
'''
x , y = np.ogrid[:total_row , :total_col]
# get the center values of the image
cen_x , cen_y = total_row/2 , total_col/2
'''
Measure distance value from center to each border
pixel.
To make it easy, we can think it's like, we draw
a line from center-
to each edge pixel value --> s**2 = (Y-y)**2
+ (X-x)**2
'''
distance_from_the_center = np.sqrt((x-cen_x)**2
+ (y-cen_y)**2)
# Select convenient radius value
radius = (total_row/2)
# Using logical operator '>'
'''
logical operator to do this task which will return
as a value
of True for all the index according to the given
condition
'''
circular_pic = distance_from_the_center > radius
'''
let assign value zero for all pixel value that
outside the cirular disc.
All the pixel value outside the circular disc,
will be black now.
'''
pic[circular_pic] = 0
plt.figure(figsize = (10,10))
plt.imshow(pic)
plt.show() |
ЮРаЧЭМЯёДІРэ
ЮРаЧЭМЯёМАЦфДІРэЯЕЭГЗЧГЃгагУЃЌЮвУЧПЩвдгУгкзівЛаЉЗжЮіШЮЮёЁЃ
# load the image
pic = imageio.imread('F:\satimg.jpg')
plt.figure(figsize = (10,10))
plt.imshow(pic)
plt.show() |
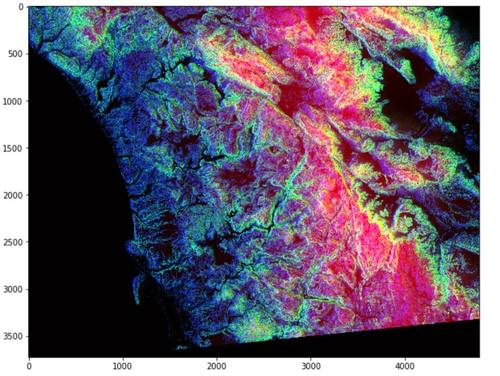
ЮвУЧРДПДвЛаЉЛљБОаХЯЂЃК
print(f'Shape
of the image {pic.shape}')
print(f'hieght {pic.shape[0]} pixels')
print(f'width {pic.shape[1]} pixels')
Shape of the image (3725, 4797, 3)
hieght 3725 pixels
width 4797 pixels |
етеХЭМЦЌЩЯгавЛаЉгаШЄЕФЖЋЮїЃЌЯёаэЖрЦфЫћЕФЭМЯёПЩЪгЛЏвЛбљЃЌУПИіRGBВужаЕФбеЩЋЖМгаздМКЕФвтЫМЁЃР§ШчЃЌКьЩЋЕФЧПЖШНЋБэЪОЯёЫижаЕФЕиРэЪ§ОнЕуЕФИпЖШЃЌРЖЩЋЕФЧПЖШБэЪОЗНЮЛЕФЖШСПЃЌТЬЩЋБэЪОаБТЪЁЃетаЉбеЩЋНЋгажњгквдИќПьЃЌИќгааЇЕФЗНЪНДЋДяДЫаХЯЂЃЌЖјВЛЪЧЯдЪОЪ§зжЁЃ
КьЩЋЯёЫиБэЪОЃКAltitudeЁЄ
РЖЩЋЯёЫиБэЪОЃКAspect
ТЬЩЋЯёЫиБэЪОЃК Slope
ЭЈЙ§ЙлВьВЪЩЋЭМЯёЃЌЮвУЧПЩвдЗжБцГіКЃАЮЪЧЖрЩйЃЌаБТЪЪЧЖрЩйЃЌвдМАSlopeЪЧЪВУДЃЌетОЭЪЧЮЊбеЩЋМгдиИќЖрКЌвхвдБэЪОИќПЦбЇЕФЗжЮіЕФЯыЗЈЁЃ
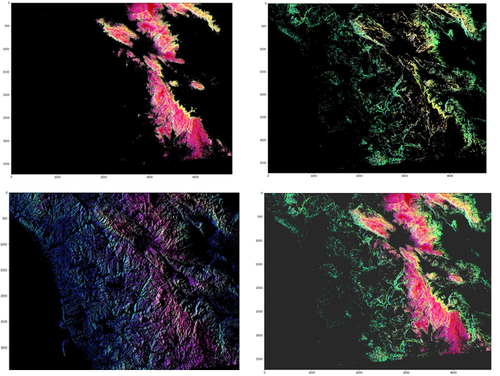
МьВтУПИіЭЈЕРЕФЯёЫи
# Only Red Pixel
value , higher than 180
pic = imageio.imread('F:\satimg.jpg')
red_mask = pic[:, :, 0] < 180
pic[red_mask] = 0
plt.figure(figsize=(15,15))
plt.imshow(pic)
# Only Green Pixel value , higher than 180
pic = imageio.imread('F:\satimg.jpg')
green_mask = pic[:, :, 1] < 180
pic[green_mask] = 0
plt.figure(figsize=(15,15))
plt.imshow(pic)
# Only Blue Pixel value , higher than 180
pic = imageio.imread('F:\satimg.jpg')
blue_mask = pic[:, :, 2] < 180
pic[blue_mask] = 0
plt.figure(figsize=(15,15))
plt.imshow(pic)
# Composite mask using logical_and
pic = imageio.imread('F:\satimg.jpg')
final_mask = np.logical_and(red_mask, green_mask,
blue_mask)
pic[final_mask] = 40
plt.figure(figsize=(15,15))
plt.imshow(pic) |
|