| 编辑推荐: |
本文主要介绍了Android
性能优化“基石”是什么? Fps,Memory,Cpu如何采集?
本文来自于51CTO,由Linda编辑、推荐。 |
|
想要做好性能优化,最主要的就是学会采集性能。
1 背景
各位大佬好久不见了,憋了一阵子发育了一下(主要是我在拼神龙斗士),基本上完成了简单的性能采集的Demo,分享一下相关的经验给各位吧。
APM(Application perfmance monitor)就是应用性能监控。在移动互联网对人们生活影响越来越大的今天,App的功能越来越全面,随之而来的就是App性能的要求越来越高,不能被动的等待用户异常的发生然后根据线上日志去修复bug,再发补丁版本。主动监控App性能变得越来越重要,分析App的耗电,UI卡顿,网络性能成为了当物之急。
当前项目的Apm开发参考了腾讯的Matrix,360的ArgusAPM,滴滴的Dokit,还有一些细小的项目等等。
根据项目进行定制,之后完成自己的Apm采集系统。
后续文章会根据我当前的开发进度缓慢更新,大家可以跟着我这个小菜鸡缓慢前行,当前完成了这三个性能指标的采集工作,后续可能还会添加线程FD信息,所以本文就会着重分析这三个点。
2 先抛出问题
一个性能数据采集系统,你不能成为一个app的负担,不能在采集的时候耽误主线程的渲染,接入了Apm之后反倒让App变得更加卡顿。
由于Fps,内存,Cpu等都是需要频繁采样的,比如Fps,一秒钟刷新60帧,如果全量数据上报,那么后端大佬可能就把我给打死了。
在业务最少介入的情况下完成关键页面数据的收集,以及将页面数据和性能数据进行绑定。
3 Fps采集
首先我们还是要先介绍下什么是Fps.
流畅度,是页面在滑动、渲染等过程中的体验。Android系统要求每一帧都要在 16ms 内绘制完成,平滑的完成一帧意味着任何特殊的帧需要执行所有的渲染代码(包括
framework 发送给 GPU 和 CPU 绘制到缓冲区的命令)都要在 16ms 内完成,保持流畅的体验。如果没有在期间完成渲染秒就会发生掉帧。掉帧是用户体验中一个非常核心的问题。丢弃了当前帧,并且之后不能够延续之前的帧率,这种不连续的间隔会容易会引起用户的注意,也就是我们常说的卡顿、不流畅。
那么是不是1s只要绘制了60帧是不是就是流畅的呢?也不一定,如果发生抖动的情况,那么肯定会有其中几帧是有问题的。其中肯定会有最大绘制帧,和最小绘制帧的情况,所以平均值,最大值最小值都是我们需要知道的。
在讨论采集之前,我们要先简单的说下两个东西Choreographer和LooperPrinter。
Choreographer(编舞者)
Choreographer中文翻译过来是"舞蹈指挥",字面上的意思就是优雅地指挥以上三个UI操作一起跳一支舞。这个词可以概括这个类的工作,如果android系统是一场芭蕾舞,他就是Android
UI显示这出精彩舞剧的编舞,指挥台上的演员们相互合作,精彩演出。Google的工程师看来挺喜欢舞蹈的!
其中关于Choreographer的介绍相关的可以参考这篇文章* https://juejin.im/post/6890407553457963022*,面试中也经常会问到这个问题,ViewRootImp和Vsync等等,但是我们还是比较专注于数据的采集和上报,所以关注的重点还是有点不同。
一般常规的Fps采集可以通过Choreographer既UI线程绘制的编舞者,Choreographer是一个ThreadLocal的单例,接收vsync信号进行界面的渲染,我们只要对其添加一个CallBack,就可以巧妙的计算出这一帧的绘制时长。
Matrix对于核心Choreographer是对CallbackQueue的hook,通过hook
addCallbackLocked分别在不同类型的回调队列的头部添加自定义的FrameCallback。
这样系统CALLBACK_INPUT = 自定义CALLBACK_ANIMATION的开始时间-自定义CALLBACK_INPUT的完成时间
系统CALLBACK_ANIMATION = 自定义CALLBACK_TRAVERSAL开始时间-自定义CALLBACK_ANIMATION开始时间
系统CALLBACK_TRAVERSAL = msg dipatch结束时间- 自定义CALLBACK_TRAVERSAL开始时间
LooperPrinter
首先我们先要有个概念,所有的View相关的和生命周期相关的都被执行在主线程上。那么我们有没有方法可以监控到主线程耗时呢?
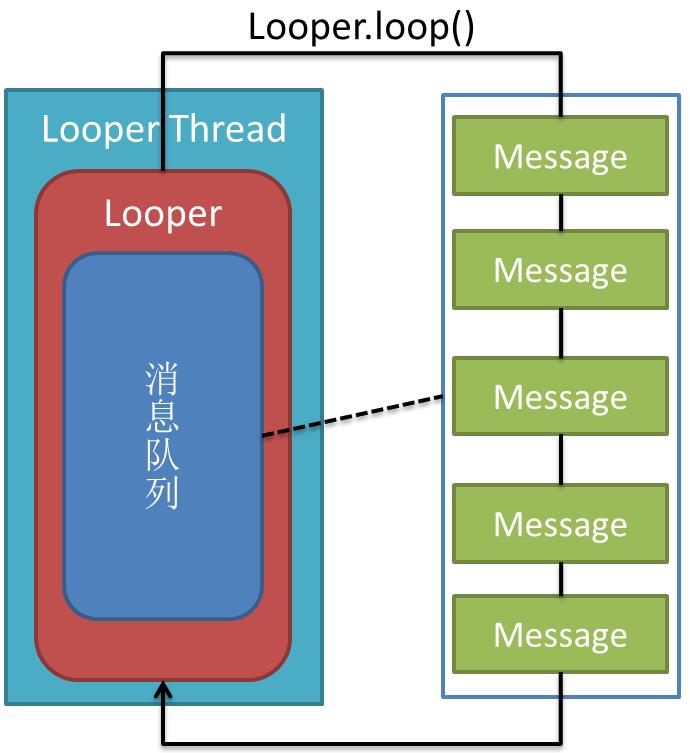
我们盘一盘Handler是如何执行的,首先Looper从MessageQueue中获取到Message,之后判断Message内部的Handler或者Runnable来决定执行后续的操作。
从ActivityThread分析,所有的主线程操作的被执行在主线程的Looper上,那么我们是不是只要在主线程的Looper的loop方法,获取到Message的前后执行加上写代码就能监控到一个Message
被执行的时长了呢。
public static
void loop() {
final Looper me = myLooper();
if (me == null) {
throw new RuntimeException("No Looper; Looper.prepare()
wasn't called on this thread.");
}
final MessageQueue queue = me.mQueue;
// Make sure the identity of this thread is
that of the local process,
// and keep track of what that identity token
actually is.
Binder.clearCallingIdentity();
final long ident = Binder.clearCallingIdentity();
// Allow overriding a threshold with a system
prop. e.g.
// adb shell 'setprop log.looper.1000.main.slow
1 && stop && start'
final int thresholdOverride =
SystemProperties.getInt("log.looper."
+ Process.myUid() + "."
+ Thread.currentThread().getName()
+ ".slow", 0);
boolean slowDeliveryDetected = false;
for (;;) {
Message msg = queue.next(); // might block
if (msg == null) {
// No message indicates that the message queue
is quitting.
return;
}
// This must be in a local variable, in case
a UI event sets the logger
final Printer logging = me.mLogging;
if (logging != null) {
logging.println(">>>>> Dispatching
to " + msg.target + " " +
msg.callback + ": " + msg.what);
}
...
if (logging != null) {
logging.println("<<<<< Finished
to " + msg.target + " " + msg.callback);
}
...
}
} |
从源码上我们可以看到Looper一开始就预留了一个Printer的类,其中在Message执行开始和Message执行结束之后都会执行Printer方法。我们可以通过
looper.setMessageLogging(new LooperPrinter());的方法来设置这个监控。

IdleHandler
当Looper中的MessageQueue为空的情况下,会触发IdleHandler,所以主线程卡顿,一般都会配合这个一起来重置耗时时间,这样就能保证主线程空置的情况下,方法耗时不会计算出错。
UIThreadMonitor(主线程监控)
简单的介绍了下上面几个东西之后,我们的Fps采集的这部分实际的采样代码我参考了下Matrix的UIThreadMonitor,而UIThreadMonitor则是通过上述几个组合的方式来完成的。
private void
dispatchEnd() {
long traceBegin = 0;
if (config.isDevEnv()) {
traceBegin = System.nanoTime();
}
long startNs = token;
long intendedFrameTimeNs = startNs;
if (isVsyncFrame) {
doFrameEnd(token);
intendedFrameTimeNs = getIntendedFrameTimeNs(startNs);
}
long endNs = System.nanoTime();
synchronized (observers) {
for (LooperObserver observer : observers) {
if (observer.isDispatchBegin()) {
observer.doFrame(AppMethodBeat.getVisibleScene(),
startNs, endNs, isVsyncFrame, intendedFrameTimeNs,
queueCost[CALLBACK_INPUT], queueCost[CALLBACK_ANIMATION],
queueCost[CALLBACK_TRAVERSAL]);
}
}
}
dispatchTimeMs[3] = SystemClock.currentThreadTimeMillis();
dispatchTimeMs[1] = System.nanoTime();
AppMethodBeat.o(AppMethodBeat.METHOD_ID_DISPATCH);
synchronized (observers) {
for (LooperObserver observer : observers) {
if (observer.isDispatchBegin()) {
observer.dispatchEnd(dispatchTimeMs[0], dispatchTimeMs[2],
dispatchTimeMs[1], dispatchTimeMs[3], token,
isVsyncFrame);
}
}
}
this.isVsyncFrame = false;
if (config.isDevEnv()) {
MatrixLog.d(TAG, "[dispatchEnd#run] inner
cost:%sns", System.nanoTime() - traceBegin);
}
} |
UIThreadMonitor则不太一样,其中dispatchEnd方法有其中LooperMonitor所接受到的。
而LooperMonitor他通过主线程的Looper的setMessageLogging方法设置一个LooperPrinter。dispatchEnd在主线程的方法执行结束之后,通过反射Choreographer获取当前的绘制的Vsync和渲染时长。最后当IdleHandler被触发的时候,则重置LooperPrinter时间的方式,从而避免主线程闲置状况下方法耗时计算出问题。
这部分源代的传送门Matrix LoopMonitor
为什么要绕一个大圈子来监控Fps呢?这么写的好处是什么呢?
我特地去翻查了下Matrix官方的wiki *https://github.com/Tencent/matrix/wiki/Matrix-Android-TraceCanary
*,Martix参考了BlockCanary的代码,通过结合了下Choreographer和BlockCanary,当出现卡顿帧的时候获取当前的主线程卡顿的堆栈,然后通过LooperPrinter把当前的卡顿的堆栈方法输出,这样可以更好的辅助开发去定位卡顿问题,而不是直接告诉业务方你的页面卡顿了。
采样分析
文章开始抛出过一个问题,如果采集的每一个数据都上报首先会对服务器产生巨大的无效数据压力,其次也会有很多无效的数据上报,那么应该怎么做呢?
这一块我们参考了Matrix的代码,首先Fps数据不可能是实时上报的,其次最好能从一个时间段内的数据中筛选出有问题的数据,Matrix的Fps采集的有几个小细节其实做的很好。
延迟200毫秒.先收集200帧的数据,然后对其数据内容进行分析,筛选遍历出最大帧最小帧,以及平均帧,之后内存保存数据。
子线程处理数据,筛选遍历的操作移动到子线程,这样避免APM反倒造成App卡顿问题。
200毫秒的数据只是作为其中一个数据片段,Matrix的上报节点是以一个更长的时间段作为上报的,当时间超过1分钟左右的情况下,才会作为一个Issue片段上报。
前后台切换状态并不需要采集数据。
private void
notifyListener(final String focusedActivity, final
long startNs, final long endNs, final boolean
isVsyncFrame,
final long intendedFrameTimeNs, final long inputCostNs,
final long animationCostNs, final long traversalCostNs)
{
long traceBegin = System.currentTimeMillis();
try {
final long jiter = endNs - intendedFrameTimeNs;
final int dropFrame = (int) (jiter / frameIntervalNs);
droppedSum += dropFrame;
durationSum += Math.max(jiter, frameIntervalNs);
synchronized (listeners) {
for (final IDoFrameListener listener : listeners)
{
if (config.isDevEnv()) {
listener.time = SystemClock.uptimeMillis();
}
if (null != listener.getExecutor()) {
if (listener.getIntervalFrameReplay() > 0)
{
listener.collect(focusedActivity, startNs, endNs,
dropFrame, isVsyncFrame,
intendedFrameTimeNs, inputCostNs, animationCostNs,
traversalCostNs);
} else {
listener.getExecutor().execute(new Runnable()
{
@Override
public void run() {
listener.doFrameAsync(focusedActivity, startNs,
endNs, dropFrame, isVsyncFrame,
intendedFrameTimeNs, inputCostNs, animationCostNs,
traversalCostNs);
}
});
}
} else {
listener.doFrameSync(focusedActivity, startNs,
endNs, dropFrame, isVsyncFrame,
intendedFrameTimeNs, inputCostNs, animationCostNs,
traversalCostNs);
}
...
}
}
}
} |
上面是Matirx的源代码,其中我们可以看出listener.getIntervalFrameReplay()
> 0当这个条件触发的情况下,listener会先做一次collection操作,当触发到一定的数据量之后,才会触发后续的逻辑。其次我们可以看到判断了null
!= listener.getExecutor(),所以这部分收集的操作被执行在线程池中。
| private class
FPSCollector extends IDoFrameListener {
private Handler frameHandler = new Handler(MatrixHandlerThread.getDefaultHandlerThread().getLooper());
Executor executor = new Executor() {
@Override
public void execute(Runnable command) {
frameHandler.post(command);
}
};
private HashMap<String, FrameCollectItem>
map = new HashMap<>();
@Override
public Executor getExecutor() {
return executor;
}
@Override
public int getIntervalFrameReplay() {
return 200;
}
@Override
public void doReplay(List<FrameReplay>
list) {
super.doReplay(list);
for (FrameReplay replay : list) {
doReplayInner(replay.focusedActivity, replay.startNs,
replay.endNs, replay.dropFrame, replay.isVsyncFrame,
replay.intendedFrameTimeNs, replay.inputCostNs,
replay.animationCostNs, replay.traversalCostNs);
}
}
public void doReplayInner(String visibleScene,
long startNs, long endNs, int droppedFrames,
boolean isVsyncFrame, long intendedFrameTimeNs,
long inputCostNs,
long animationCostNs, long traversalCostNs)
{
if (Utils.isEmpty(visibleScene)) return;
if (!isVsyncFrame) return;
FrameCollectItem item = map.get(visibleScene);
if (null == item) {
item = new FrameCollectItem(visibleScene);
map.put(visibleScene, item);
}
item.collect(droppedFrames);
if (item.sumFrameCost >= timeSliceMs) {
// report
map.remove(visibleScene);
item.report();
}
}
}
private class FrameCollectItem {
String visibleScene;
long sumFrameCost;
int sumFrame = 0;
int sumDroppedFrames;
// record the level of frames dropped each time
int[] dropLevel = new int[DropStatus.values().length];
int[] dropSum = new int[DropStatus.values().length];
FrameCollectItem(String visibleScene) {
this.visibleScene = visibleScene;
}
void collect(int droppedFrames) {
float frameIntervalCost = 1f * UIThreadMonitor.getMonitor().getFrameIntervalNanos()
/ Constants.TIME_MILLIS_TO_NANO;
sumFrameCost += (droppedFrames + 1) * frameIntervalCost;
sumDroppedFrames += droppedFrames;
sumFrame++;
if (droppedFrames >= frozenThreshold) {
dropLevel[DropStatus.DROPPED_FROZEN.index]++;
dropSum[DropStatus.DROPPED_FROZEN.index] +=
droppedFrames;
} else if (droppedFrames >= highThreshold)
{
dropLevel[DropStatus.DROPPED_HIGH.index]++;
dropSum[DropStatus.DROPPED_HIGH.index] += droppedFrames;
} else if (droppedFrames >= middleThreshold)
{
dropLevel[DropStatus.DROPPED_MIDDLE.index]++;
dropSum[DropStatus.DROPPED_MIDDLE.index] +=
droppedFrames;
} else if (droppedFrames >= normalThreshold)
{
dropLevel[DropStatus.DROPPED_NORMAL.index]++;
dropSum[DropStatus.DROPPED_NORMAL.index] +=
droppedFrames;
} else {
dropLevel[DropStatus.DROPPED_BEST.index]++;
dropSum[DropStatus.DROPPED_BEST.index] += Math.max(droppedFrames,
0);
}
}
} |
这部分代码则是Matrix对于一个帧片段进行数据处理的逻辑。可以看出,collect方法内筛选出了最大最小等等多个纬度的数据,丰富了一个数据片段。这个地方数据越多越能帮助一个开发定位问题。
采集逻辑也参考了Matrix的这部分代码,但是在实际测试阶段发现了个小Bug,因为上报的是一个比较大的时间片段,用户切换了页面之后,会把上个页面的fps数据也当做下个页面的数据上报。
所以我们增加了一个ActivityLifeCycle,当页面发生变化的情况下进行一次数据上报操作。其次我们把Matrix内的前后台切换等逻辑也进行了一次调整,更换成更可靠的ProcessLifecycleOwner。
4 Cpu和Memory
内存和Cpu的使用状况可以更好的帮我们检测线上用户的真实情况,而不是等到用户crash之后我们再去反推这个问题,可以根据页面维度筛选出不同的页面数据,方便开发分析对应的问题。
在已经获取到Fps的经验之后,我们在这个基础上增加了Cpu和Memory的数据收集。相对来说我们可以借鉴大量的采集逻辑,然后只要在获取关键性数据进行调整就好了。
数据在子线程中采集,避免采集数据卡顿主线程。
同时每秒采集一次数据,数据内容本地分析,计算峰值谷值均值
数据上报节点拆分,一定时间内,页面切换,生成一个数据。
合并Cpu和内存数据,作为同一个数据结构上报,优化数据流量问题。
Memory 数据采集
Memory的数据我们参考了下Dokit的代码,高低版本也有差异,高版本可以直接通过Debug.MemoryInfo()获取到内存的数据,低版本则需要通过ams获取到ActivityManager从中获取数据。
以下是性能采集的工具类同时采集了cpu数据,各位可以直接使用。
object PerformanceUtils
{
private var CPU_CMD_INDEX = -1
@JvmStatic
fun getMemory(): Float {
val mActivityManager: ActivityManager? = Hasaki.getApplication().getSystemService(Context.ACTIVITY_SERVICE)
as ActivityManager?
var mem = 0.0f
try {
var memInfo: Debug.MemoryInfo? = null
if (Build.VERSION.SDK_INT > 28) {
// 统计进程的内存信息 totalPss
memInfo = Debug.MemoryInfo()
Debug.getMemoryInfo(memInfo)
} else {
//As of Android Q, for regular apps this method
will only return information about the memory
info for the processes running as the caller's
uid;
// no other process memory info is available and
will be zero. Also of Android Q the sample rate
allowed by this API is significantly limited,
if called faster the limit you will receive the
same data as the previous call.
val memInfos = mActivityManager?.getProcessMemoryInfo(intArrayOf(Process.myPid()))
memInfos?.firstOrNull()?.apply {
memInfo = this
}
}
memInfo?.apply {
val totalPss = totalPss
if (totalPss >= 0) {
mem = totalPss / 1024.0f
}
}
} catch (e: Exception) {
e.printStackTrace()
}
return mem
}
/**
* 8.0以下获取cpu的方式
*
* @return
*/
private fun getCPUData(): String {
val commandResult = ShellUtils.execCmd("top
-n 1 | grep ${Process.myPid()}", false)
val msg = commandResult.successMsg
return try {
msg.split("\\s+".toRegex())[CPU_CMD_INDEX]
} catch (e: Exception) {
"0.5%"
}
}
@WorkerThread
fun getCpu(): String {
if (CPU_CMD_INDEX == -1) {
getCpuIndex()
}
if (CPU_CMD_INDEX == -1) {
return ""
}
return if (Build.VERSION.SDK_INT >= Build.VERSION_CODES.O)
{
getCpuDataForO()
} else {
getCPUData()
}
}
/**
* 8.0以上获取cpu的方式
*
* @return
*/
private fun getCpuDataForO(): String {
return try {
val commandResult = ShellUtils.execCmd("top
-n 1 | grep ${Process.myPid()}", false)
var cpu = 0F
commandResult.successMsg.split("\n").forEach
{
val cpuTemp = it.split("\\s+".toRegex())
val cpuRate = cpuTemp[CPU_CMD_INDEX].toFloatOrNull()?.div(Runtime.getRuntime()
.availableProcessors())?.div(100) ?: 0F
cpu += cpuRate
}
NumberFormat.getPercentInstance().format(cpu)
} catch (e: Exception) {
""
}
}
private fun getCpuIndex() {
try {
val process = Runtime.getRuntime().exec("top
-n 1")
val reader = BufferedReader(InputStreamReader(process.inputStream))
var line: String? = null
while (reader.readLine().also { line = it }
!= null) {
line?.let {
line = it.trim { it <= ' ' }
line?.apply {
val tempIndex = getCPUIndex(this)
if (tempIndex != -1) {
CPU_CMD_INDEX = tempIndex
}
}
}
}
} catch (e: Exception) {
e.printStackTrace()
}
}
private fun getCPUIndex(line: String): Int {
if (line.contains("CPU")) {
val titles = line.split("\\s+".toRegex()).toTypedArray()
for (i in titles.indices) {
if (titles[i].contains("CPU")) {
return i
}
}
}
return -1
}
}
|
Cpu采集
Cpu的数据采集代码也在上面,这部分代码相对来说也比较简单,复杂的地方在于命令行以及版本适配的问题。获取的时候也需要区分系统版本,高低版本均通过cmd命令获取,修复了低版本的CpuId获取失败的问题。然后优化了下DoKit的代码逻辑。ShellUtils则可以参考Blank写的工具类集合。
5 总结
Fps,cpu,内存这些数据只能算是Apm中最简单的一个环节而已,Apm的实际目的是要更好的辅助开发人员去定位线上出现的问题状况,通过预警机制避免线上问题的产生以及对性能的监控。而后续还需要收集更多的用户行为数据等来辅助开发来更准确的定位线上的问题。
因为站在了巨人的肩膀上,所以其实这部分开发的难度相对来说少了很多,但是还是有一部分可以继续优化的空间的,比如当前我们只监控了Activity的变化,有没有办法根据Fragment的不同进行数据上报呢,还有数据内容有没有办法提取更多的信息相关。
|


 订阅
订阅