| БрМЭЦМі: |
БОЮФжївЊНщЩмPrometheus
ЪЧгЩ SoundCloud ПЊдДМрПиИцОЏНтОіЗНАИЃЌвдМАPromQLЕФЪ§ОнВщбЏ DSL
гябдгыХфжУЃЌЯЃЭћЖдФњЕФбЇЯАгаЫљАяжњЁЃ
БОЮФРДздгкМђЪщЃЌгЩЛ№СњЙћШэМўAliceБрМЁЂЭЦМіЁЃ |
|
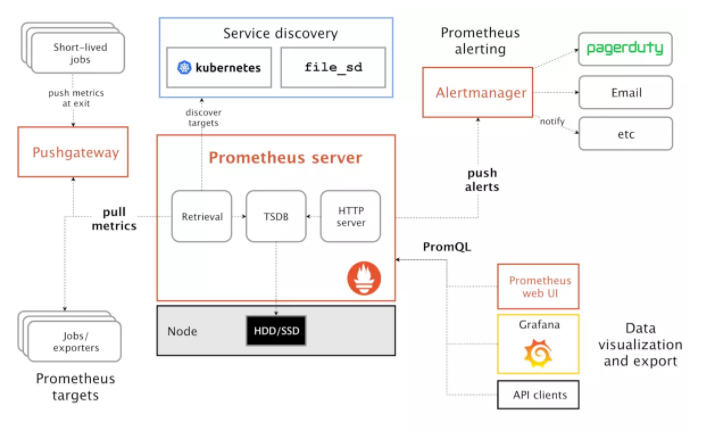
Prometheus ЪЧгЩ SoundCloud ПЊдДМрПиИцОЏНтОіЗНАИЁЃ
prometheus
prometheusДцДЂЕФЪЧЪБађЪ§ОнЃЌМДАДЯрЭЌЪБађ(ЯрЭЌУћГЦКЭБъЧЉ)ЃЌвдЪБМфЮЌЖШДцДЂСЌајЕФЪ§ОнЕФМЏКЯЁЃ
ЪБађ(time series)ЪЧгЩУћзж(Metric)вдМАвЛзщkey/valueБъЧЉЖЈвхЕФЃЌОпгаЯрЭЌЕФУћзжвдМАБъЧЉЪєгкЯрЭЌЪБађЁЃ
metricУћзжЃКБэЪОmetricЕФЙІФмЃЌШчhttp_request_totalЁЃЪБађЕФУћзжгЩ ASCII
зжЗћЃЌЪ§зжЃЌЯТЛЎЯпЃЌвдМАУАКХзщГЩЃЌЫќБиаыТњзуе§дђБэДяЪН [a-zA-Z_:][a-zA-Z0-9_:]*,
ЦфУћзжгІИУОпгагявхЛЏЃЌвЛАуБэЪОвЛИіПЩвдЖШСПЕФжИБъЃЌР§Шч http_requests_total, ПЩвдБэЪО
http ЧыЧѓЕФзмЪ§ЁЃ
БъЧЉЃК
бљБОЃКАДееФГИіЪБађвдЪБМфЮЌЖШВЩМЏЕФЪ§ОнЃЌГЦжЎЮЊбљБОЁЃЪЕМЪЕФЪБМфађСаЃЌУПИіађСаАќРЈвЛИіfloat64ЕФжЕКЭвЛИіКСУыМЖЕФЪБМфДС
вЛИі float64 жЕ
вЛИіКСУыМЖЕФ unix ЪБМфДС
ИёЪНЃКPrometheusЪБађИёЪНгыOpenTSDBЯрЫЦЃК
| <metric name>{<label
name>=<label value>, ...} |
MetricРраЭЃК
Counter: вЛжжРлМгЕФmetricЃЌШчЧыЧѓЕФИіЪ§ЃЌНсЪјЕФШЮЮёЪ§ЃЌГіЯжЕФДэЮѓЪ§ЕШ
Gauge: ГЃЙцЕФmetric,ШчЮТЖШЃЌПЩШЮвтМгМѕЁЃЦфЮЊЫВЪБЕФЃЌгыЪБМфУЛгаЙиЯЕЕФЃЌПЩвдШЮвтБфЛЏЕФЪ§ОнЁЃ
Histogram: жљзДЭМЃЌгУгкЙлВьНсЙћВЩбљЃЌЗжзщМАЭГМЦЃЌШчЃКЧыЧѓГжајЪБМфЃЌЯьгІДѓаЁЁЃЦфжївЊгУгкБэЪОвЛЖЮЪБМфФкЖдЪ§ОнЕФВЩбљЃЌВЂФмЙЛЖдЦфжИЖЈЧјМфМАзмЪ§НјааЭГМЦЁЃИљОнЭГМЦЧјМфМЦЫу
Summary: РрЫЦHistogramЃЌгУгкБэЪОвЛЖЮЪБМфФкЪ§ОнВЩбљНсЙћЃЌЦфжБНгДцДЂquantileЪ§ОнЃЌЖјВЛЪЧИљОнЭГМЦЧјМфМЦЫуГіРДЕФЁЃВЛашвЊМЦЫуЃЌжБНгДцДЂНсЙћ
PromQL
PromQL (Prometheus Query Language) ЪЧ Prometheus здМКПЊЗЂЕФЪ§ОнВщбЏ
DSL гябдЁЃ
ВщбЏНсЙћРраЭЃК
ЫВЪБЪ§Он (Instant vector): АќКЌвЛзщЪБађЃЌУПИіЪБађжЛгавЛИіЕуЃЌР§ШчЃКhttp_requests_total
ЧјМфЪ§Он (Range vector): АќКЌвЛзщЪБађЃЌУПИіЪБађгаЖрИіЕуЃЌР§ШчЃКhttp_requests_total[5m]
ДПСПЪ§Он (Scalar): ДПСПжЛгавЛИіЪ§зжЃЌУЛгаЪБађЃЌР§ШчЃКcount(http_requests_total)
ВщбЏЬѕМўЃКЭЈЙ§УћГЦМАБъЧЉНјааВщбЏЃЌШчhttp_requests_totalЕШМлгк{name="http_requests_total"}
ВщбЏlevel="info"ЕФevent: logback_events_total{level="info"}
ВщбЏЬѕМўжЇГже§дђЦЅХфЃК
http_requests_total{code!="200"}
// БэЪОВщбЏ code ВЛЮЊ "200" ЕФЪ§Он
http_requests_total{code=ЁЋ"2.."}
// БэЪОВщбЏ code ЮЊ "2xx" ЕФЪ§Он
http_requests_total{code!ЁЋ"2.."}
// БэЪОВщбЏ code ВЛЮЊ "2xx" ЕФЪ§Он |
ФкжУКЏЪ§ЃК
ШчНЋИЁЕуЪ§зЊЛЛЮЊећЪ§ЃК
floor(avg(http_requests_total{code="200"}))
ceil(avg(http_requests_total{code="200"})) |
ВщПДУПУыЪ§Он ЃК
| rate(http_requests_total[5m]) |
ЛљБОВщбЏЃК
1.ВщбЏЕБЧАЫљгаЪ§Он
2.ФЃК§ВщбЏЃК
logback_events_total{level=~"in.."}
logback_events_total{level=~"in.*"} |
3.БШНЯВщбЏЃК
4.ЗЖЮЇВщбЏЃК Й§ШЅ5ЗжжгЪ§Он
ЪБМфЗЖЮЇЕЅЮЛгавдЯТЃК
s: Уы
m: Зжжг
h: аЁЪБ
d: Ьь
w: жм
y: Фъ
дкЫВЪБЯђСПБэДяЪНЛђепЧјМфЯђСПБэДяЪНжаЃЌЖМЪЧвдЕБЧАЪБМфЮЊЛљзМЁЃ
ШчЙћЯыВщбЏ5ЗжюЫЧАЕФЫВЪБбљБОЪ§ОнЃЌдђашвЊЪЙгУЮЛвЦВйзїЃЌЙиМќзжЃКoffset,
ЦфвЊНєИњдкбЁдёЦї{}КѓУцЁЃШчЃК
sum(http_requests_total{method="GET"}
offset 5m)
rate(http_requests_total[5m] offset 1w) |
ОлКЯЁЂЭГМЦИпМЖВщбЏЃК
1. countВщбЏЃК count(logback_events_total)
2. sumВщбЏЃК sum(logback_events_total)
3. svgВщбЏЃК
4. topk: ШчВщбЏ2ЕФжЕЃКtopk(2, logback_events_total)
5. irate: ШчВщбЏЙ§ШЅ5ЗжжгЕФЦНОљжЕ: irate( logback_events_total[5m])
ХфжУ
ЦєЖЏЪБЃЌПЩвдМгдидЫааВЮЪ§-config.fileжИЖЈХфжУЮФМўЃЌ ФЌШЯЮЊprometheus.yml:
дкИУХфжУЮФМўжаПЩвджИЖЈИїжжЪєадЃЌЦфНсЙЙЬхЖЈвхШчЯТЃК
type Config struct
{
GlobalConfig GlobalConfig `yaml:"global"`
AlertingConfig AlertingConfig `yaml:"alerting,omitempty"`
RuleFiles []string `yaml:"rule_files,omitempty"`
ScrapeConfigs []*ScrapeConfig `yaml:"scrape_configs,omitempty"`
RemoteWriteConfigs []*RemoteWriteConfig `yaml:"remote_write,omitempty"`
RemoteReadConfigs []*RemoteReadConfig `yaml:"remote_read,omitempty"`
// Catches all undefined fields and must be
empty after parsing.
XXX map[string]interface{} `yaml:",inline"`
// original is the input from which the config
was parsed.
original string
}
|
ШЋОжХфжУ
global: жївЊгаЫФИіЪєад
scrape_interval: РШЁ targets ЕФФЌШЯЪБМфМфИєЁЃ
scrape_timeout: РШЁвЛИі target ЕФГЌЪБЪБМфЁЃ
evaluation_interval: жДаа rules ЕФЪБМфМфИєЁЃ
external_labels: ЖюЭтЕФЪєадЃЌЛсЬэМгЕНРШЁЕФЪ§ОнВЂДцЕНЪ§ОнПтжаЁЃ
Exporter
ИКд№Ъ§ОнЛуБЈЕФГЬађЭГвЛНаExporterЃЌВЛЭЌЕФExporterИКд№ВЛЭЌЕФвЕЮёЁЃЦфЭГвЛУќУћИёЪНЃКxx_exporter
вбгаexporter
clientlib
pullФЃЪН
prometheus.ymlФкШнШчЯТЃК
global:
scrape_interval: 15s
evaluation_interval: 15s
rule_files:
# - "first.rules"
# - "second.rules"
scrape_configs:
- job_name: 'spring'
metrics_path: '/actuator/prometheus'
static_configs:
- targets: ['здМКБОЛњip:8080']
|
ЦєЖЏprometheus dockerЃК
docker run
--name prom --hostname prom -p 9090:9090 -v
/Users/liukun/config/prometheus.yml:/etc/prometheus
/prometheus.yml prom/prometheus |
ЦєЖЏвдКѓЃЌЮвУЧдЫааhttp://localhost:9090 ПЩвдЗУЮЪPrometheusЁЃ
Pushgateway
ЪЙгУPushgatewayдвђЃК
PrometheusВЩгУpullФЃЪНЃЌПЩФмгЩгкВЛдквЛИізгЭјЛђЗРЛ№ЧНЕМжТЮоЗЈжБНгРШЁИїtargetЪ§Он
ашвЊНЋВЛЭЌЪ§ОнЛузмКѓЃЌдйгЩPrometheusЭГвЛЪеМЏ
ЦфШБЕуЃК
pushgatewayхДЛњгАЯьЗЖЮЇЛсИќДѓЁЃ
prometheusРШЁзДЬЌupжЛеыЖдpushgatewayЃЌЮоЗЈзіЕНЖдУПИіНкЕугааЇЁЃ
pushgatewayПЩвдГжОУЛЏЭЦЫЭИјЫќЕФЫљгаМрПиЪ§Он
docker run -d
\
--name=pg \
-p 9091:9091 \
prom/pushgateway |
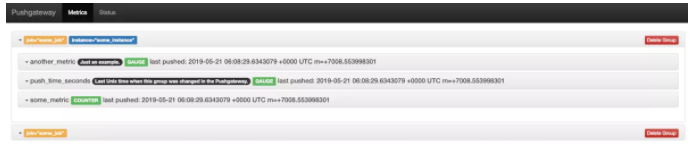
дкЦфЦєЖЏКѓЃЌЭЈЙ§ЗУЮЪЃКhttp://localhost:9091ОЭПЩвдВщПДЕНЦфНчУц

pushgatewayФЌШЯЪЧВЛГжОУЛЏЪ§ОнЕФЃЌШчЙћашвЊЃЌдђПЩвдЭЈЙ§ЦєЖЏЪБМгШыВЮЪ§
| docker run -d
-p9091:9091 prom/pushgateway "-persistence.file=push_file" |
ЯђpushgatewayЭЦЫЭЪ§ОнЃК
1. ЪЙгУClient SDK
2. жБНгЪЙгУAPI
ЪЙгУAPIЯђPushgatewayЭЦЪ§Он
ШчЯТЮЊжБНгЪЙгУAPIНјааЪ§ОнЭЦЫЭЃК
| echo "some_metric
3.14" | curl --data-binary @- http://localhost:9091/metrics/job/some_job |
ЗЂЫЭИќИДдгЕФЪ§ОнЃЌПЩвдЛЙЩЯinstanceЃЌБэЪОРДдДЮЛжУЃК
cat <<EOF
| curl --data-binary @- http://localhost:9091/metrics/job/some_job/instance
/some_instance
# TYPE some_metric counter
some_metric{label="val1"} 42
# TYPE another_metric gauge
# HELP another_metric Just an example
another_metric 2398.283
EOF |
ЩОГ§Ъ§ОнЃКШчЙћФГИіМрПиЪ§ОнВЛдйашвЊЃЌдђжЛгаЪжЖЏЩОГ§ВХЩњаЇЃЌЗёдђШдШЛВЩМЏЕФЮЊОЩжЕ
// ЩОГ§ФГИізщЯТФГИіЪЕР§ЕФЫљгаЪ§Он
curl -X DELETE http://localhost:9091/metrics/job/some_job/instance/
some_instance
// ЩОГ§ФГИізщЯТЕФЫљгаЪ§Он
curl -X DELETE http://localhost:9091/metrics/job/some_job |
ЭЈЙ§Client SDKЭЦЫЭmetricаХЯЂЕНPushgateway:
1.ЬэМгpomвРРЕЃК
<dependency>
<groupId>io.prometheus</groupId>
<artifactId>simpleclient_pushgateway</artifactId>
<version>0.6.0</version>
</dependency> |
2.ЬэМгХфжУЃКдкPrometheusЕФХфжУЮФМўжаХфжУЃЌШУЦфДгPushgatewayЩЯНјааЪ§ОнВЩМЏЃЌетРя0.51.14.23:9091ЮЊЮвPushgatewayЕФЕижЗЖЫПкЁЃХфжУЭъКѓашвЊжиЦєЪЙЦфХфжУЩњаЇ
scrape_configs:
- job_name: 'pushgateway'
static_configs:
- targets: ['10.51.14.23:9091']
labels:
instance: "pushgateway" |
3.ДњТыЃК
@Test
public void pushToGateWay() throws Exception
{
CollectorRegistry registry = new CollectorRegistry();
Gauge duration = Gauge.build().name("my_batch_job_duration_seconds")
help("Duration of my batch job in second").register(registry);
Gauge.Timer durationTimer = duration.startTimer();
try {
Gauge lastSuccess = Gauge.build().name("my_batch_job_last_success")
help("Last time my batch job successed,
in unixtime")
register(registry);
lastSuccess.setToCurrentTime();
} finally {
durationTimer.setDuration();
PushGateway pg = new PushGateway("localhost:9091");
pg.pushAdd(registry, "my_batch_job");
}
} |
|