| 编辑推荐: |
| 本文来源CSDN,本文介绍了zabbix监控nginx性能以及zabbix使用percona的模板监控mysql的过程等相关内容。 |
|
一、zabbix监控nginx性能
1.安装nginx 服务
[root@server2
~]# rpm -ivh nginx-1.8.0-1.el6.ngx.x86_64.rpm
warning: nginx-1.8.0-1.el6.ngx.x86_64.rpm: Header
V4 RSA/SHA1 Signature, key ID 7bd9bf62: NOKEY
Preparing... ###########################################
[100%]
1:nginx ###########################################
[100%]
----------------------------------------------------------------------
Thanks for using nginx!
Please find the official documentation for nginx
here:
* http://nginx.org/en/docs/
Commercial subscriptions for nginx are available
on:
* http://nginx.com/products/
---------------------------------------------------------------------- |
2.编辑nginx的配置文件
[root@server2
~]# cd /etc/nginx/conf.d/
[root@server2 conf.d]# ls
default.conf example_ssl.conf
[root@server2 conf.d]# vim default.conf
location /status {
stub_status on; # Nginx中的stub_status模块主要用于查看Nginx的一些状态信息.
本模块默认是不编译进Nginx,如果需要使用该模块,则要在编译安装Nginx时指定:./configure
–with-http_stub_status_module
access_log off; # 关闭日志记录
}[root@server2 conf.d]# nginx -t
nginx: the configuration file /etc/nginx/nginx.conf
syntax is ok
nginx: configuration file /etc/nginx/nginx.conf
test is successful
[root@server2 conf.d]# nginx
[root@server2 conf.d]# /etc/init.d/nginx restart
[root@server2 conf.d]# ps ax
2094 ? Ss 0:00 nginx: master process /usr/sbin/nginx
-c /etc
2096 ? S 0:00 nginx: worker process |

网页测试:
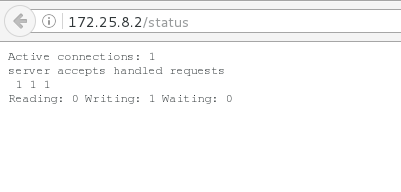
显示nginx性能计数
active 并发连接数
server 连接的服务器数
accepts 获取接受请求数
handled 建立三次握手的次数
requests 请求次数
[root@server2
conf.d]# vim default.conf
allow 127.0.0.1; # 只允许本机访问
deny all;
[root@server2 conf.d]# nginx -s reload |

3.测试:
[root@server2
conf.d]# curl http://127.0.0.1/status
Active connections: 1
server accepts handled requests
2 2 4
Reading: 0 Writing: 1 Waiting: 0
[root@server2 conf.d]# curl http://172.25.8.2/status
<html>
<head><title>403 Forbidden</title></head>
<body bgcolor="white">
<center><h1>403 Forbidden</h1></center>
<hr><center>nginx/1.8.0</center>
</body>
</html> |
4.过滤监控参数
[root@server2
conf.d]# curl -s http://127.0.0.1/status | grep
Active
Active connections: 1
[root@server2 conf.d]# curl -s http://127.0.0.1/status
| grep Active | awk '{print $3}'
1
[root@server2 conf.d]# cd /etc/zabbix/zabbix_agentd.d
[root@server2 zabbix_agentd.d]# ls
userparameter_mysql.conf
[root@server2 zabbix_agentd.d]# cp userparameter_mysql.conf
userparameter_nginx.conf
[root@server2 zabbix_agentd.d]# vim userparameter_nginx.conf
UserParameter=nginx.active,curl -s http://127.0.0.1/status
| grep Active | awk '{print $3}' # 获取并发连接数
UserParameter=nginx.active1,curl -s http://127.0.0.1/status
| awk '/^\ /' | awk '{print $1}' # 获取接受请求数
UserParameter=nginx.active2,curl -s http://127.0.0.1/status
| awk '/^\ /' | awk '{print $2}' # 获取建立三次握手的次数
UserParameter=nginx.active3,curl -s http://127.0.0.1/status
| awk '/^\ /' | awk '{print $3}' # 获取请求次数
[root@server2 zabbix_agentd.d]# /etc/init.d/zabbix-agent
start
Starting Zabbix agent: [ OK ] |

5.打开zabbix-agent ,可以在监控主机中监控
[root@server2
zabbix_agentd.d]# /etc/init.d/zabbix-agent start
Starting Zabbix agent: [ OK ]
[root@server2 zabbix_agentd.d]# chkconfig zabbix-agent
on #开机自启 |
6.在监控主机中(server1)中安装rpm -ivh zabbix-get-3.4.6-1.el7.x86_64.rpm
zabbix_get 是 zabbix 服务端的一个命令,用于检测
agent 端的配置是否正确,可以很方便地知道 key是否能正常获取到数据,在测试自定义监控的时候特别有用
[root@server1
~]# rpm -ivh zabbix-get-3.4.6-1.el7.x86_64.rpm
warning: zabbix-get-3.4.6-1.el7.x86_64.rpm: Header
V4 RSA/SHA512 Signature, key ID a14fe591: NOKEY
Preparing... #################################
[100%]
Updating / installing...
1:zabbix-get-3.4.6-1.el7 #################################
[100%] |
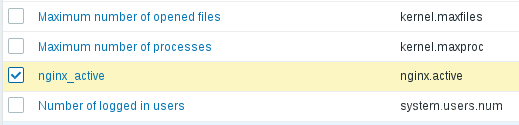
获取agent端的键值:
[root@server1
~]# zabbix_get -s 172.25.8.2 -p 10050 -k 'nginx.active'
1 |
7.在zabbix网页中加入监控项和图形,开始检测
(1)选择监控主机
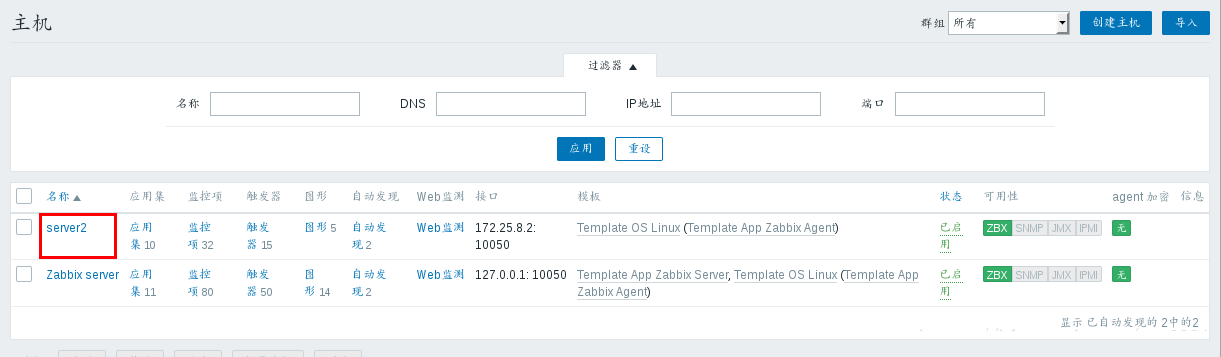
(2)添加监控项
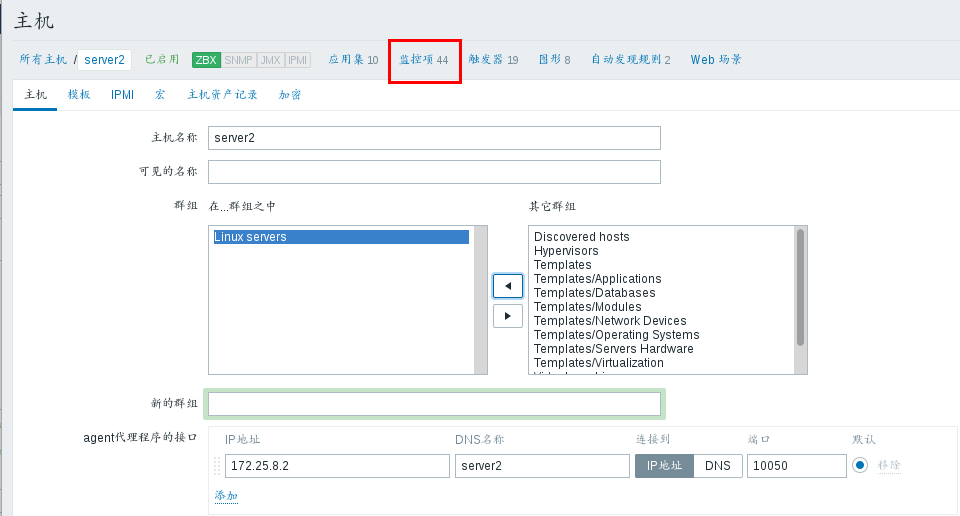
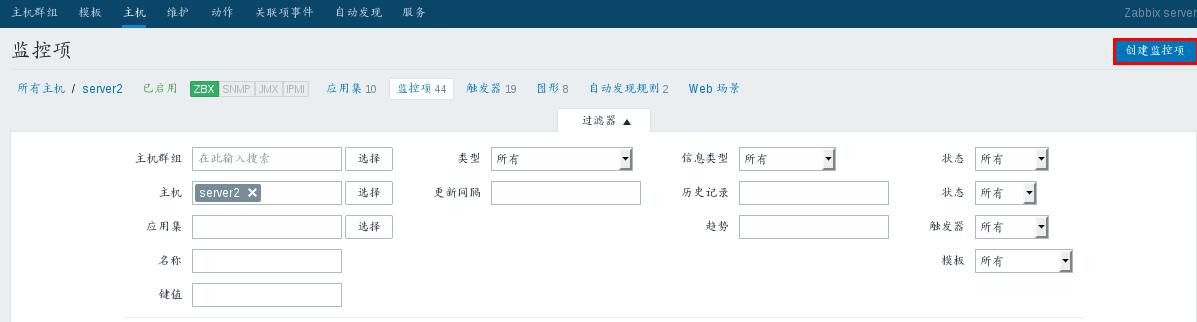
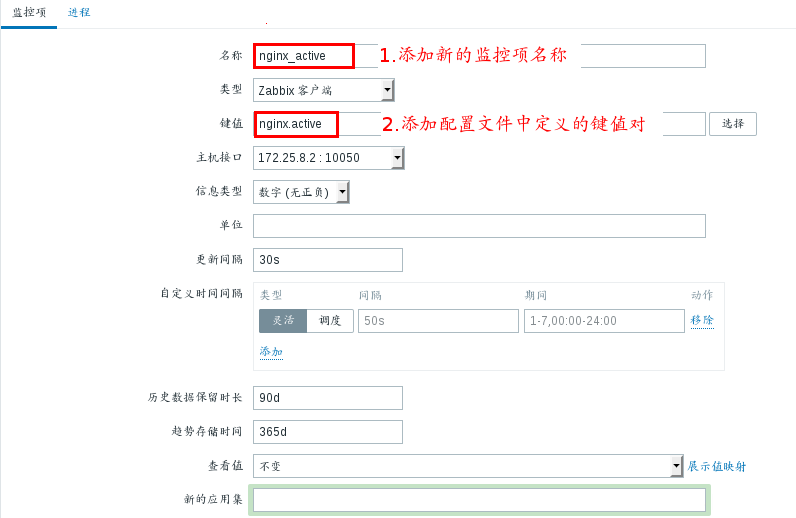
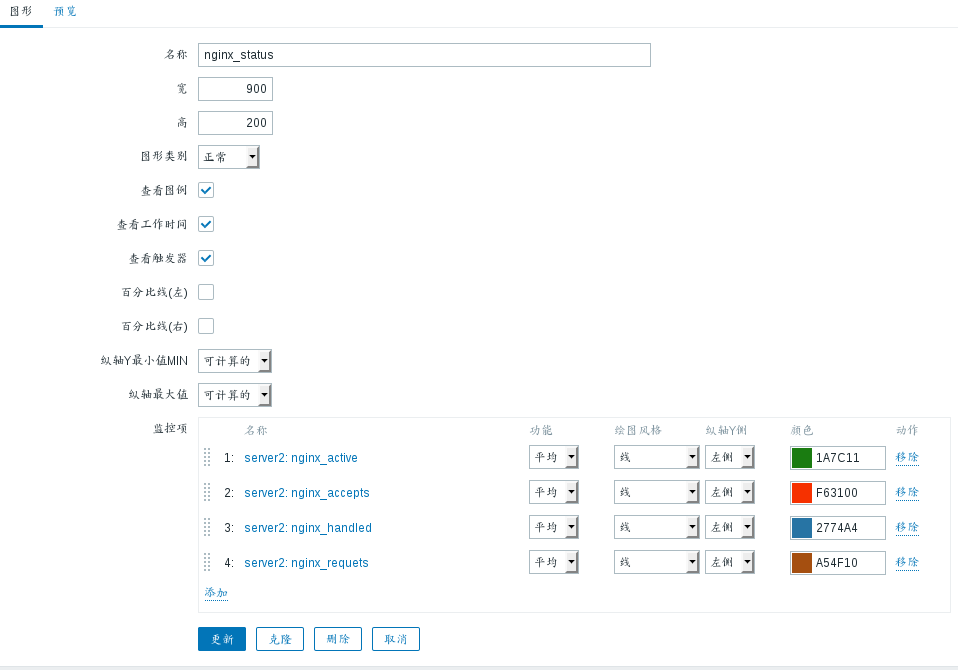
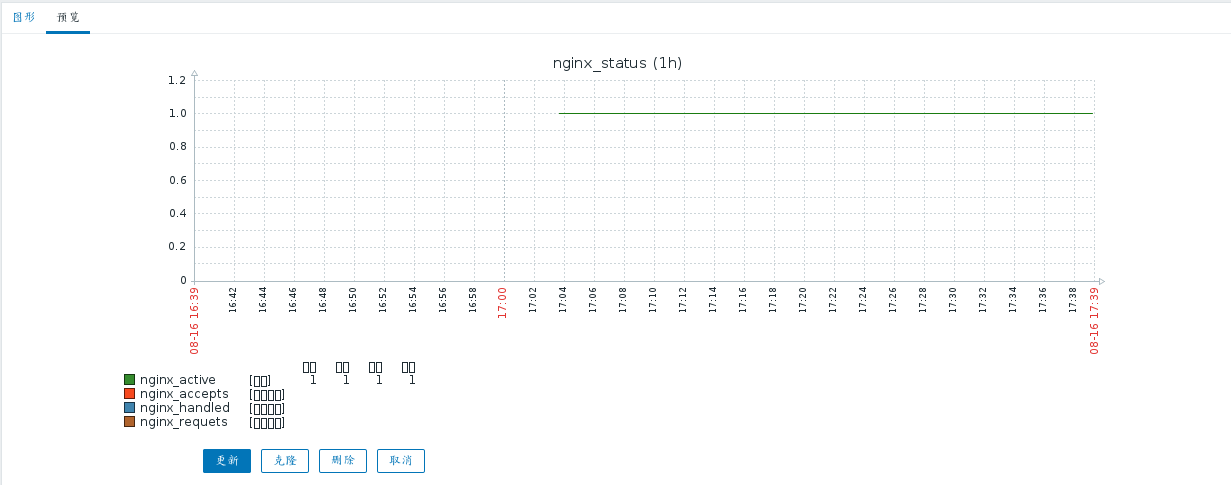
(3)添加监控图形

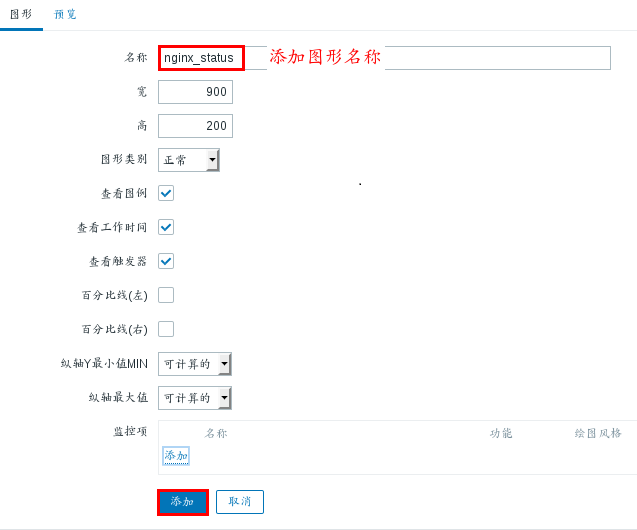

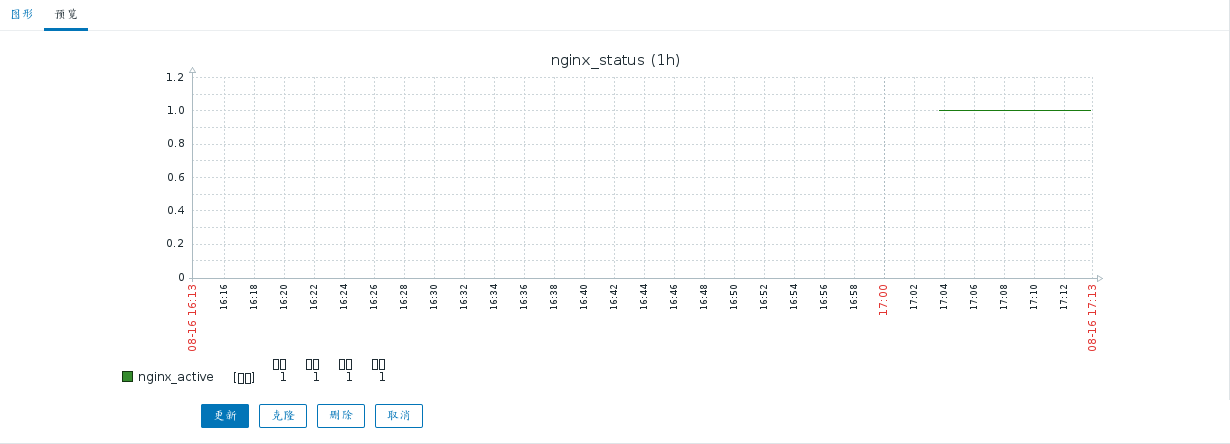
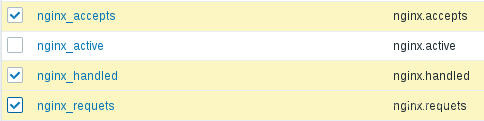
以同样方式添加accepts,handled,requets

二、zabbix使用percona的模板监控mysql
在server1(zabbix监控端)中:
1.安装percona-zabbix模版
[root@server1
~]# rpm -ivh percona-zabbix-templates-1.1.8-1.noarch.rpm
warning: percona-zabbix-templates-1.1.8-1.noarch.rpm:
Header V4 DSA/SHA1 Signature, key ID cd2efd2a:
NOKEY
Preparing... #################################
[100%]
Updating / installing...
1:percona-zabbix-templates-1.1.8-1 #################################
[100%]
Scripts are installed to /var/lib/zabbix/percona/scripts
#脚本所在目录
Templates are installed to /var/lib/zabbix/percona/templates
#模本所在目录 |
2.拷贝userparameter_percona_mysql.conf
文件到被监控的mysql服务器
[root@server1
~]# cd /var/lib/zabbix/percona/templates/
[root@server1 templates]# ls
userparameter_percona_mysql.conf
zabbix_agent_template_percona_mysql_server_ht_2.0.9-sver1.1.8.xml
[root@server1 templates]# cp userparameter_percona_mysql.conf
/etc/zabbix/zabbix_agentd.d |
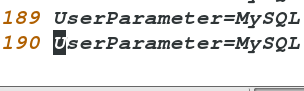
3.测试percona的脚本,过滤监控项有190个
[root@server1
templates]# /var/lib/zabbix/percona/scripts/
get_mysql_stats_wrapper.sh
gg
[root@server1 templates]# cd /etc/
zabbix/zabbix_agentd.d/
[root@server1 zabbix_agentd.d]# cat userparameter_percona_mysql.conf
|
4.由于percona的监控脚本是使用php写的,所以需要准备好php运行环境,这里直接用yum安装.安装完成后将zabbix的数据库和密码写入php脚本中…
[root@server1
zabbix_agentd.d]# yum install php php_fpm -y
[root@server1 zabbix_agentd.d]# vim ~zabbix/.my.cnf
[client]
user = root
password = westos
[root@server1 zabbix_agentd.d]# systemctl restart
zabbix-agent |
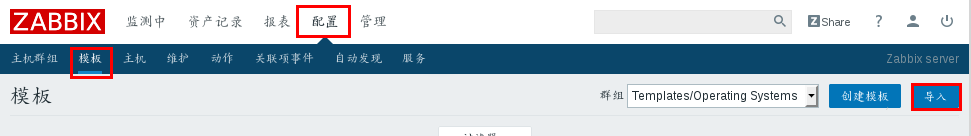
5.在zabbix的web端导入模版
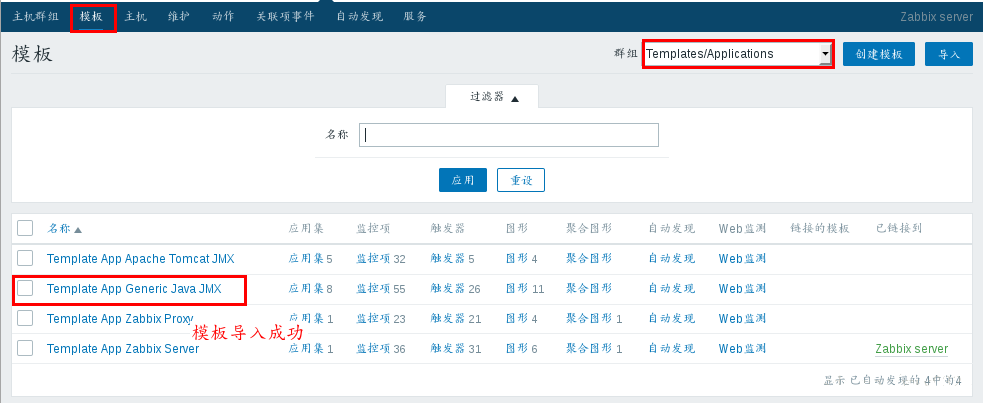
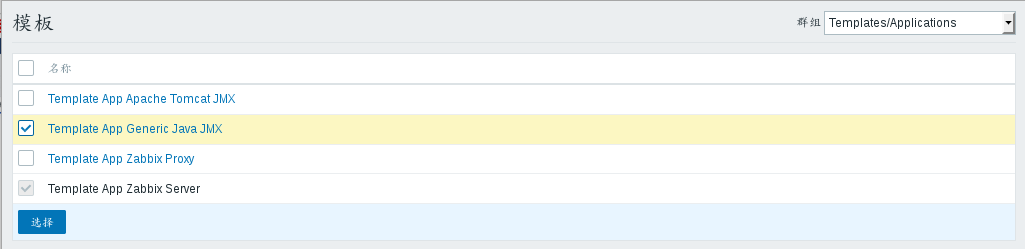
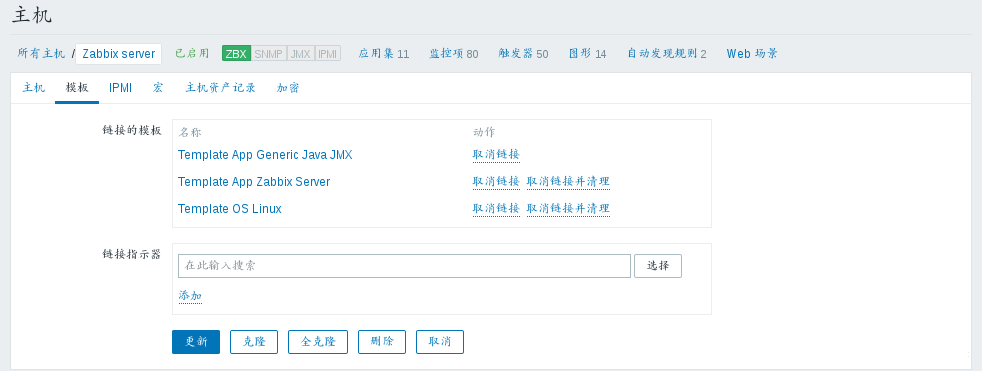
可以尝试在让某台主机使用该模版,添加进去则为成功:
三、zabbix使用JMX监控tomcat
1.在server2(agent的客户端)上安装tomcat和jdk,并打开tomcat |