| 编辑推荐: |
本文中简单介绍了ELK,安装设置单节点
ELK,命令行启动一个 ELK,elasticsearch 重要的参数调优,filebeat
配置等,希望对您有所帮助。
本文来自于segmentfault,由火龙果软件Delores编辑、推荐。 |
|
前言
Elasticsearch + Logstash + Kibana(ELK)是一套开源的日志管理方案,分析网站的访问情况时我们一般会借助Google/百度/CNZZ等方式嵌入JS做数据统计,但是当网站访问异常或者被攻击时我们需要在后台分析如Nginx的具体日志,而Nginx日志分割/GoAccess/Awstats都是相对简单的单节点解决方案,针对分布式集群或者数据量级较大时会显得心有余而力不足,而ELK的出现可以使我们从容面对新的挑战。
Logstash:负责日志的收集,处理和储存
Elasticsearch:负责日志检索和分析
Kibana:负责日志的可视化
ELK(Elasticsearch + Logstash + Kibana)
ELK简介
ELK 官方文档 是一个分布式、可扩展、实时的搜索与数据分析引擎。目前我在工作中只用来收集 server 的 log, 开发锅锅们 debug 的好助手。
安装设置单节点 ELK
如果你想快速的搭建单节点 ELK, 那么使用 docker 方式肯定是你的最佳选择。使用三合一的镜像
注意:安装完 docker, 记得设置 mmap counts 大小至少 262144
# 设置 mmap 命令
# 临时添加法
sysctl -w vm.max_map_count=262144
# 写入 sysctl.conf 文件里
vim /etc/sysctl.conf
vm.max_map_count=262144
# 保存好文件执行以下命令
sysctl -p
# 安装 docker
sudo yum install -y yum-utils
device-mapper-persistent-data
lvm2
sudo yum-config-manager --add-repo https://download.docker.com/
linux/centos/docker-ce.repo
sudo yum install -y docker-ce
sudo systemctl start docker |
单节点的机器,不必暴露 9200(Elasticsearch JSON interface) 和 9300(Elasticsearch transport interface) 端口。
如果想在 docker 上暴露端口,用 -p 如果没有填写监听的地址,默认是 0.0.0.0 所有的网卡。建议还是写明确监听的地址,安全性更好。
-p 监听的IP:宿主机端口:容器内的端口
-p 192.168.10.10:9300:9300 |
命令行启动一个 ELK
sudo docker
run -p 5601:5601
-p 5044:5044 \
-v /data/elk-data:/var
/lib/elasticsearch \
-v /data/elk/logstash:
/etc/logstash/conf.d \
-it -e TZ="Asia/Singapore"
-e ES_HEAP_SIZE="20g"
\
-e LS_HEAP_SIZE="10g"
--name elk-ubuntu
sebp/elk |
将配置和数据挂载出来,即使 docker container 出现了问题。可以立即销毁再重启一个,服务受影响的时间很短。
# 注意挂载出来的文件夹的权限问题
chmod 755 /data/elk-data
chmod 755 /data/elk/logstash
chown -R root:root /data
-v /data/elk-data:/var/lib
/elasticsearch # 将 elasticsearch
存储的数据挂载出来,数据持久化。
-v /data/elk/logstash:/etc/
logstash/conf.d # 将
logstash
的配置文件挂载出来,方便在宿主机上修改。 |
elasticsearch 重要的参数调优
ES_HEAP_SIZE Elasticsearch will assign the entire heap specified in jvm.options via the Xms (minimum heap size) and Xmx (maximum heap size) settings. You should set these two settings to be equal to each other. Set Xmx and Xms to no more than 50% of your physical RAM.the exact threshold varies but is near 32 GB. the exact threshold varies but 26 GB is safe on most systems, but can be as large as 30 GB on some systems.
利弊关系: The more heap available to Elasticsearch, the more memory it can use for its internal caches, but the less memory it leaves available for the operating system to use for the filesystem cache. Also, larger heaps can cause longer garbage collection pauses.
LS_HEAP_SIZE 如果 heap size 过低,会导致 CPU 利用率到达瓶颈,造成 JVM 不断的回收垃圾。 不能设置 heap size 超过物理内存。 至少留 1G 给操作系统和其他的进程。
只需要配置logstash
接下来,我们再来看一看 logstash.conf 记得看注释
}
}
}
# 因为线上的机器更多,线上的我默认不在
filebeat 添加 function,
所以 else
我就添加上 live
else {
mutate {
add_field => {
"function" =>
"live"
}
}
}
# 在之前 filter message 时,我们得到了
timestamp,这里我们修改一下格式,添加上时区。
date {
match => ["timestamp" ,
"yyyy-MM-dd
HH:mm:ss Z"]
target => "@timestamp"
timezone => "Asia/Singapore"
}
# 将之前获得的 path 替换其中的 / 替换为 - ,
因为 elasticsearch
index name 有要求
# 例如 feiyang/test feiyang_test
mutate {
gsub => ["path","/","-"]
add_field => {"host_ip" =>
"%{[fields][host]}"}
remove_field => ["tags","@version",
"offset","beat","fields",
"exim_year","exim_month","exim_day",
"exim_time","timestamp"]
}
# remove_field 去掉一些多余的字段
}
# 单节点 output 就在本机,也不需要 SSL,
但 index 的命名规则还是需要非常的注意
output {
elasticsearch {
hosts => ["localhost:9200"]
index => "sg-%{function}-%
{path}-%{+xxxx.ww}"
# sg-nginx-feiyang233.club.
access-2019.13 ww代表周数
}
} |
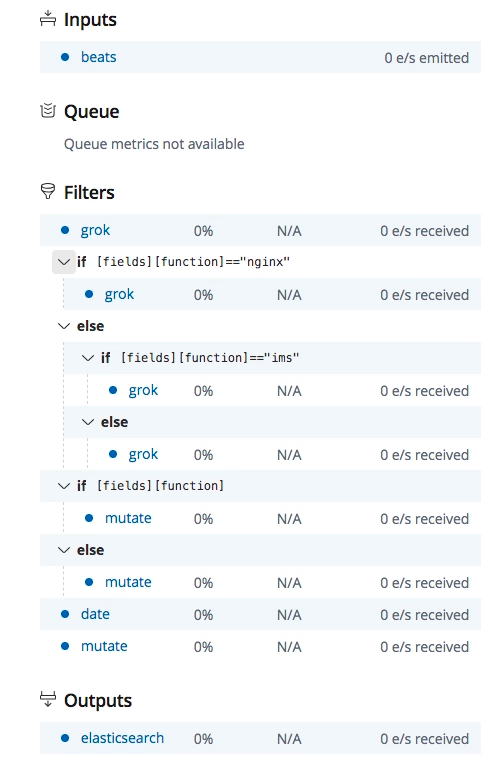
最终的流程图如下所示
index 的规则
Lowercase only
Cannot include , /, *, ?, ", <, >, |, ` ` (space character), ,, #
Indices prior to 7.0 could contain a colon (:),
but that’s been deprecated and won’t be supported in 7.0+
Cannot start with -, _, +
Cannot be . or ..
Cannot be longer than 255 bytes
(note it is bytes, so multi-byte characters
will count towards the 255 limit faster)
filebeat 配置
在 client 端,我们需要安装并且配置 filebeat
配置文件 filebeat.yml
filebeat.inputs:
- type: log
enabled: true
paths: # 需要收集的日志
- /var/log/app/** ## ** need
high versiob filebeat
can
support recursive
fields: #需要添加的字段
host: "{{inventory_hostname}}"
function: "xxx"
multiline: # 多行匹配
match: after
negate: true # pay attention
the format
pattern: '^\[[0-9]{4}
-[0-9]{2}-[0-9]{2}' #\[
ignore_older: 24h
clean_inactive: 72h
output.logstash:
hosts: ["{{elk_server}}:25044"]
# ssl:
# certificate_authorities:
["/etc/filebeat/logstash.crt"] |
批量部署 filebeat.yml 最好使用 ansible
---
- hosts: all
become: yes
gather_facts: yes
tasks:
- name: stop filebeat
service:
name: filebeat
state: stopped
enabled: yes
- name: upload filebeat.yml
template:
src: filebeat.yml
dest: /etc/filebeat/filebeat.yml
owner: root
group: root
mode: 0644
- name: remove
file: #delete all files
in this directory
path: /var/lib/filebeat/registry
state: absent
- name: restart filebeat
service:
name: filebeat
state: restarted
enabled: yes |
查看 filebeat output
首先需要修改配置,将 filebeat 输出到本地的文件,输出的格式为 json.
filebeat.inputs:
- type: log
enabled: true
paths:
- /var/log/app/**
fields:
host: "x.x.x.x"
region: "sg"
multiline:
match: after
negate: true
pattern: '^[0-9]{4}
-[0-9]{2}-[0-9]{2}'
ignore_older: 24h
clean_inactive: 72h
output.file:
path: "/home/feiyang"
filename: feiyang.json |
通过上述的配置,我们就可以在路径 /home/feiyang 下得到输出结果文件 feiyang.json 在这里需要注意的是,不同版本的 filebeat 输出结果的格式会有所不同,这会给 logstash 解析过滤造成一点点困难。下面举例说明 6.x 和 7.x filebeat 输出结果的不同
{
"@timestamp":
"2019-06-27T15:53:27.682Z",
"@metadata":
{
"beat": "filebeat",
"type": "doc",
"version":
"6.4.2"
},
"fields": {
"host":
"x.x.x.x",
"region": "sg"
},
"host": {
"name":
"x.x.x.x"
},
"beat": {
"name":
"x.x.x.x",
"hostname":
"feiyang-localhost",
"version":
"6.4.2"
},
"offset": 1567983499,
"message":
"[2019-06-27T22:53:25.756327232][Info][@http.go.177]
[48552188]request",
"source":
"/var/log/feiyang/scripts/all.log"
} |
6.4 与 7.2 还是有很大的差异,在结构上。
{
"@timestamp":
"2019-06-27T15:41:42.991Z",
"@metadata":
{
"beat": "filebeat",
"type": "_doc",
"version":
"7.2.0"
},
"agent": {
"id":
"3a38567b-e6c3-4b5a-a420-f0dee3a3bec8",
"version": "7.2.0",
"type":
"filebeat",
"ephemeral_id":
"b7e3c0b7-b460-
4e43-a9af-6d36c25eece7",
"hostname": "feiyang-localhost"
},
"log": {
"offset":
69132192,
"file": {
"path":
"/var/log/app/feiyang/scripts/info.log"
}
},
"message": "2019-06-27
22:41:25.312|WARNING|14186|Option
|data|unrecognized|fields=set([u'id'])",
"input": {
"type": "log"
},
"fields": {
"region":
"sg",
"host": "x.x.x.x"
},
"ecs": {
"version":
"1.0.0"
},
"host": {
"name":
"feiyang-localhost"
}
} |
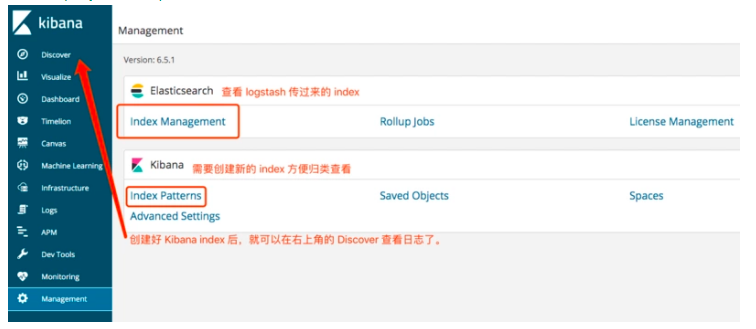
Kibana 简单的使用
在搭建 ELK 时,暴露出来的 5601 端口就是 Kibana 的服务。
安装设置集群 ELK 版本 6.7
ELK 安装文档集群主要是高可用,多节点的 Elasticsearch 还可以扩容。本文中用的官方镜像 The base image is centos:7
Elasticsearch 多节点搭建
# 挂载出来的文件夹权限非常的重要
mkdir -p /data/elk-data &&
chmod 755 /data/elk-data
chown -R root:root /data
docker run -p WAN_IP:9200:9200
-p 10.66.236.116:9300:9300
\
-v /data/elk-data:/usr/share
/elasticsearch/data
\
--name feiy_elk \
docker.elastic.co/elasticsearch
/elasticsearch:6.7.0 |
接下来是修改配置文件 elasticsearch.yml
# Master 节点 node-1
# 进入容器 docker exec -it
[container_id] bash
# docker exec -it 70ada825aae1 bash
# vi /usr/share/elasticsearch
/config/elasticsearch.yml
cluster.name: "feiy_elk"
network.host: 0.0.0.0
node.master: true
node.data: true
node.name: node-1
network.publish_host: 10.66.236.116
discovery.zen.ping.unicast.hosts: ["10.66.236.116:9300","10.66.236.
118:9300","10.66.236.115:9300"]
# exit
# docker restart 70ada825aae1 |
# slave 节点 node-2
# 进入容器 docker exec -it
[container_id] bash
# vi /usr/share/elasticsearch
/config/elasticsearch.yml
cluster.name: "feiy_elk"
network.host: "0.0.0.0"
node.name: node-2
node.data: true
network.publish_host: 10.66.236.118
discovery.zen.ping.unicast.hosts: ["10.66.236.116:9300","10.66.236.
118:9300","10.66.236.115:9300"]
# exit
# docker restart 70ada825aae1 |
# slave 节点 node-3
# 进入容器 docker exec -it
[container_id] bash
# vi /usr/share/elasticsearch
/config/elasticsearch.yml
cluster.name: "feiy_elk"
network.host: "0.0.0.0"
node.name: node-3
node.data: true
network.publish_host: 10.66.236.115
discovery.zen.ping.unicast.hosts: ["10.66.236.116:9300","10.66.236.
118:9300","10.66.236.115:9300"]
# exit
# docker restart 70ada825aae1 |
检查集群节点个数,状态等
# curl http://wan_ip:9200
/_cluster/health?pretty
{
"cluster_name" : "feiy_elk",
"status" : "green",
"timed_out"
: false,
"number_of_nodes" : 3,
"number_of_data_nodes" : 3,
"active_primary_shards"
: 9,
"active_shards" : 18,
"relocating_shards"
: 0,
"initializing_shards" : 0,
"unassigned_shards" : 0,
"delayed_unassigned_shards"
: 0,
"number_of_pending_tasks" :
0,
"number_of_in_flight_fetch" :
0,
"task_max_waiting_in_queue_millis"
: 0,
"active_shards_percent_as_number"
: 100.0
} |
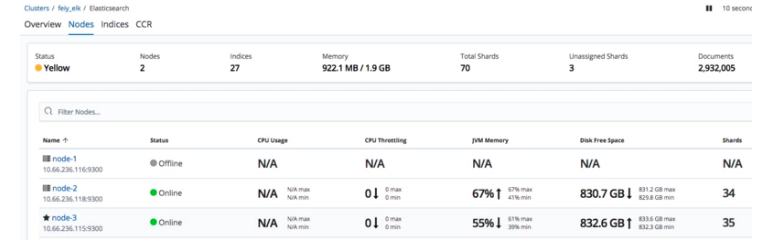
最终结果图在 kibana 上可以看到集群状态
Kibana 搭建
# docker run
--link YOUR_
ELASTICSEARCH_CONTAINER
_NAME_OR_ID:elasticsearch
-p 5601:5601 {docker-repo}:{version}
docker run -p 外网IP:5601:5601
--link elasticsearch容器的ID:
elasticsearch
docker.elastic.co
/kibana/kibana:6.7.0
# 注意的是 --link 官方其实并不推荐的,
推荐的是 use user-defined
networks https://docs.docker.com/network/links/
# 测试不用 --link 也可以通。
直接用容器的 IP
docker run -p 外网IP:5601:5601 docker.elastic.co/kibana/kibana:6.7.0 |
we recommend that you use user-defined networks to facilitate
communication between two containers instead of using
# vi /usr/share
/kibana/config/kibana.yml
# 需要把 hosts IP 改为
elasticsearch 容器的 IP
# 我这里 elasticsearch 容器的
IP 是 172.17.0.2
# 如何查看 docker inspect
elasticsearch_ID
server.name: kibana
server.host: "0.0.0.0"
elasticsearch.hosts:
[ "http://172.17.0.2:9200"
]
xpack.monitoring.ui.container.
elasticsearch.enabled:
true
# 退出容器并重启
docker restart [container_ID] |
Logstash 搭建
# docker -d
以后台的方式启动容器
--name 参数显式地为容器命名
docker run -p 5044:5044 -d --name
test_logstash
docker.elastic.co
/logstash/logstash:6.7.0
# 也可以指定网卡,监听在内网或者外网
监听在内网 192.168.1.2
docker run -p 192.168.1.2:5044:5044
-d --name
test_logstash docker.elastic.co/logstash/logstash:6.7.0 |
# vi /usr/share/logstash/pipeline
/logstash.conf
# 配置详情请参考下面的链接,记得
output hosts IP 指向 Elasticsearch
的 IP
# Elasticsearch 的默认端口是9200,
在下面的配置中可以省略。
hosts => ["IP Address 1:port1",
"IP
Address 2:port2", "IP Address 3"] |
logstash 过滤规则 见上文的配置和 grok 语法规则
# vi /usr/share/logstash/config
/logstash.yml
# 需要把 url 改为 elasticsearch
master 节点的 IP
http.host: "0.0.0.0"
xpack.monitoring.elasticsearch.url: http://elasticsearch_master_IP:9200
node.name: "feiy"
pipeline.workers: 24 # same with cores |
改完配置 exit 从容器里退出到宿主机,然后重启这个容器。
# 如何查看 container_ID
docker ps -a
docker restart [container_ID] |
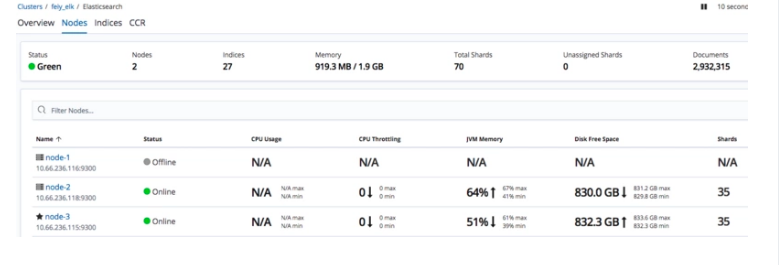
容灾测试
我们把当前的 master 节点 node-1 关机,通过 kibana 看看集群的状态是怎样变化的。
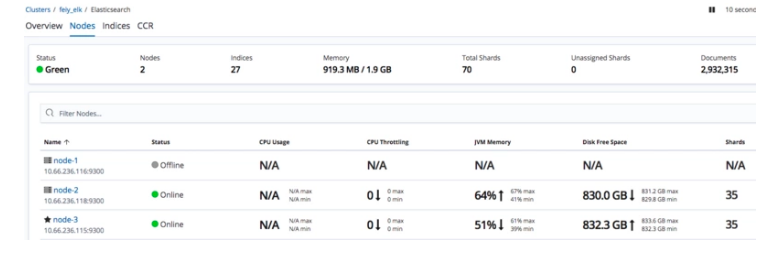
当前集群的状态变成了黄色,因为还有 3 个 Unassigned Shards。颜色含义请参考官方文档,再过一会发现集群状态变成了绿色。
kibana 控制台 Console
Quick intro to the UI
The Console UI is split into two panes:
an editor pane (left) and a response pane (right).
Use the editor to type requests and submit them to Elasticsearch.
The results will be displayed in the response pane on the right side.
Console understands requests in a compact format, similar to cURL:
# index a doc
PUT index/type/1
{
"body": "here"
}
# and get it ...
GET index/type/1 |
While typing a request, Console will make suggestions
which you can then accept by hitting Enter/Tab.
These suggestions are made based on the request structure as well as your indices and types.
A few quick tips, while I have your attention
Submit requests to ES using the green triangle button.
Use the wrench menu for other useful things.
You can paste requests in cURL format and
they will be translated to the Console syntax.
You can resize the editor and output panes
by dragging the separator between them.
Study the keyboard shortcuts under the Help button. Good stuff in there!
Console 常用的命令
Kibana 控制台
ELK技术栈中的那些查询语法
GET _search
{
"query": {
"match_all":
{}
}
}
GET /_cat/health?v
GET /_cat/nodes?v
GET /_cluster/allocation/explain
GET /_cluster/state
GET /_cat/thread_pool?v
GET /_cat/indices?health=red&v
GET /_cat/indices?v
#将当前所有的 index 的
replicas 设置为 0
PUT /*/_settings
{
"index" : {
"number_of_replicas" : 0,
"refresh_interval": "30s"
}
}
GET /_template
# 在单节点的时候,不需要备份,
所以将 replicas 设置为 0
PUT _template/app-logstash
{
"index_patterns": ["app-*"],
"settings": {
"number_of_shards": 3,
"number_of_replicas": 0,
"refresh_interval": "30s"
}
} |
Elasticsearch 数据迁移
Elasticsearch 数据迁移官方文档感觉不是很详细。容器化的数据迁移,我太菜用 reindex 失败了,snapshot 也凉凉。
最后是用一个开源工具 An Elasticsearch Migration Tool 进行数据迁移的。
wget https://github.com/medcl/esm-abandoned/releases/download/v0.4.2
/linux64.tar.gz
tar -xzvf linux64.tar.gz
./esm -s http://127.0.0.1:9200
-d http://192.168.21.55:9200
-x
index_name -w=5 -b=10 -c 10000
--copy_settings
--copy_mappings
--force --refresh |
Nginx 代理转发
因为有时候 docker 重启,iptables restart 也会刷新,所以导致了我们的限制规则会被更改,出现安全问题。这是由于 docker 的网络隔离基于 iptable 实现造成的问题。为了避免这个安全问题,我们可以在启动 docker 时,就只监听在内网,或者本地 127.0.0.1 然后通过 nginx 转发。
# cat kibana.conf
server {
listen 25601;
server_name x.x.x.x;
access_log /var/log/nginx
/kibana.access.log;
error_log /var/log/nginx
/kibana.error.log;
location / {
allow x.x.x.x;
allow x.x.x.x;
deny all;
proxy_http_version 1.1;
proxy_buffer_size 64k;
proxy_buffers 32 32k;
proxy_busy_buffers_size 128k;
proxy_set_header Host $host;
proxy_set_header X-Real-IP
$remote_addr;
proxy_set_header X-Forwarded-For $proxy_add_x_forwarded_for;
proxy_pass http://127.0.0.1:5601;
}
} |
! 这里需要注意的是, iptable filter 表 INPUT 链 有没有阻挡 172.17.0.0/16 docker 默认的网段。是否阻挡了 25601 这个端口。
踩过的坑
iptables 防不住。需要看上一篇博客里的 iptable 问题。或者监听在内网,用 Nginx 代理转发。
elk 网络问题
elk node
discovery.type=single-node 在测试单点时可用,搭建集群时不能设置这个环境变量,详情见官方文档
ELK的一次吞吐量优化
filebeat 版本过低导致 recursive glob patterns ** 不可用
用 ansible 升级 filebeat
---
- hosts: all
become: yes
gather_facts: yes
tasks:
- name: upload filebeat.repo
copy:
src: elasticsearch.repo
dest: /etc/yum.repos.d
/elasticsearch.repo
owner: root
group: root
mode: 0644
- name: install the latest
version of filebeat
yum:
name: filebeat
state: latest
- name: restart filebeat
service:
name: filebeat
state: restarted
enabled: yes
# elasticsearch.repo
[elasticsearch-6.x]
name=Elasticsearch repository
for 6.x packages
baseurl=https://artifacts.elastic.co
/packages/6.x/yum
gpgcheck=1
gpgkey=https://artifacts.elastic.co
/GPG-KEY-elasticsearch
enabled=1
autorefresh=1
type=rpm-md |
filebeat 7.x 与 6.x 不兼容问题. 关键字变化很大, 比如说 "sorce" 变为了 log[path]
|