| БрМЭЦМі: |
БОЮФжївЊНщЩмШчКЮЭЈЙ§ЛЗОГЕФАВзАвдМАВхМўЕФАВзАМАЪЙгУРДДюНЈELKШежОЗжЮіЯЕЭГЃЌжБжСзюжеЕФЩЯЯпЃЌЯЃЭћЖдФњЕФбЇЯАгаЫљАяжњЁЃ
БОЮФРДздгкВЉПЭдАЃЌгЩЛ№СњЙћШэМўAliceБрМЁЂЭЦМіЁЃ |
|
вЛЁЂELKДюНЈЦЊ
ЙйЭјЕижЗ
ЙйЭјШЈЭўжИФЯ
АВзАжИФЯ
ELKЪЧElasticsearchЁЂLogstashЁЂKibanaЕФМђГЦЃЌетШ§епЪЧКЫаФЬзМўЃЌЕЋВЂЗЧШЋВПЁЃ
ElasticsearchЪЧЪЕЪБШЋЮФЫбЫїКЭЗжЮів§ЧцЃЌЬсЙЉЫбМЏЁЂЗжЮіЁЂДцДЂЪ§ОнШ§ДѓЙІФмЃЛЪЧвЛЬзПЊЗХRESTКЭJAVA
APIЕШНсЙЙЬсЙЉИпаЇЫбЫїЙІФмЃЌПЩРЉеЙЕФЗжВМЪНЯЕЭГЁЃЫќЙЙНЈгкApache LuceneЫбЫїв§ЧцПтжЎЩЯЁЃ
LogstashЪЧвЛИігУРДЫбМЏЁЂЗжЮіЁЂЙ§ТЫШежОЕФЙЄОпЁЃЫќжЇГжМИКѕШЮКЮРраЭЕФШежОЃЌАќРЈЯЕЭГШежОЁЂДэЮѓШежОКЭздЖЈвхгІгУГЬађШежОЁЃЫќПЩвдДгаэЖрРДдДНгЪеШежОЃЌетаЉРДдДАќРЈ
syslogЁЂЯћЯЂДЋЕнЃЈР§Шч RabbitMQЃЉКЭJMXЃЌЫќФмЙЛвдЖржжЗНЪНЪфГіЪ§ОнЃЌАќРЈЕчзггЪМўЁЂwebsocketsКЭElasticsearchЁЃ
KibanaЪЧвЛИіЛљгкWebЕФЭМаЮНчУцЃЌгУгкЫбЫїЁЂЗжЮіКЭПЩЪгЛЏДцДЂдк ElasticsearchжИБъжаЕФШежОЪ§ОнЁЃЫќРћгУElasticsearchЕФRESTНгПкРДМьЫїЪ§ОнЃЌВЛНідЪаэгУЛЇДДНЈЫћУЧздМКЕФЪ§ОнЕФЖЈжЦвЧБэАхЪгЭМЃЌЛЙдЪаэЫћУЧвдЬиЪтЕФЗНЪНВщбЏКЭЙ§ТЫЪ§Он

ЛЗОГ
Centos6.5 СНЬЈ
IPЃК192.168.1.202 АВзАЃК elasticsearchЁЂlogstashЁЂKibanaЁЂNginxЁЂHttpЁЂRedis
192.168.1.201 АВзА: logstash |
АВзА
АВзАelasticsearchЕФyumдДЕФУмдПЃЈетИіашвЊдкЫљгаЗўЮёЦїЩЯЖМХфжУЃЉ
# rpm --import https://artifacts.elastic.co/GPG-KEY-elasticsearch
ХфжУelasticsearchЕФyumдД
# vim /etc/yum.repos.d/elasticsearch.repo
дкelasticsearch.repoЮФМўжаЬэМгШчЯТФкШн
[elasticsearch-5.x]
name=Elasticsearch repository for 5.x packages
baseurl=https://artifacts.elastic.co/packages/5.x/yum
gpgcheck=1
gpgkey=https://artifacts.elastic.co/GPG-KEY-elasticsearch
enabled=1
autorefresh=1
type=rpm-md |
АВзАelasticsearchЕФЛЗОГ
АВзАelasticsearch
# yum install -y elasticsearch
АВзАjavaЛЗОГ(javaЛЗОГБиаыЪЧ1.8АцБОвдЩЯЕФ)
wget http://download.oracle.com/otn-pub/java/jdk/8u131-b11/d54c1d3a095b4ff2b6607d096fa80163/jdk-8u131-linux-x64.rpm
rpm -ivh jdk-8u131-linux-x64.rpm
бщжЄjavaАВзАГЩЙІ
java -version
java version "1.8.0_131"
Java(TM) SE Runtime Environment (build 1.8.0_131-b11)
Java HotSpot(TM) 64-Bit Server VM (build 25.131-b11,
mixed mode) |
ДДНЈelasticsearch dataЕФДцЗХФПТМЃЌВЂаоИФИУФПТМЕФЪєжїЪєзщ
# mkdir -p /data/es-data
(здЖЈвхгУгкДцЗХdataЪ§ОнЕФФПТМ)
# chown -R elasticsearch:elasticsearch /data/es-data |
аоИФelasticsearchЕФШежОЪєжїЪєзщ
| # chown -R elasticsearch:elasticsearch
/var/log/elasticsearch/ |
аоИФelasticsearchЕФХфжУЮФМў
# vim /etc/elasticsearch/elasticsearch.yml
евЕНХфжУЮФМўжаЕФcluster.nameЃЌДђПЊИУХфжУВЂЩшжУ
МЏШКУћГЦcluster.name: demon
евЕНХфжУЮФМўжаЕФnode.nameЃЌДђПЊИУХфжУВЂЩшжУ
НкЕуУћГЦ
node.name: elk-1
аоИФdataДцЗХЕФТЗОЖ
path.data: /data/es-data
аоИФlogsШежОЕФТЗОЖ
path.logs: /var/log/elasticsearch/
ХфжУФкДцЪЙгУгУНЛЛЛЗжЧј
bootstrap.memory_lock: true
МрЬ§ЕФЭјТчЕижЗ
network.host: 0.0.0.0
ПЊЦєМрЬ§ЕФЖЫПк
http.port: 9200
діМгаТЕФВЮЪ§ЃЌетбљheadВхМўПЩвдЗУЮЪes (5.xАцБОЃЌ
ШчЙћУЛгаПЩвдздМКЪжЖЏМг)
http.cors.enabled: true
http.cors.allow-origin: "*"
ЦєЖЏelasticsearchЗўЮё |
ЦєЖЏЗўЮё
/etc/init.d/elasticsearch
start
Starting elasticsearch: Java HotSpot(TM) 64-Bit
Server VM warning: INFO: os::commit_memory(0x0000000085330000,
2060255232, 0) failed; error='Cannot allocate
memory' (errno=12)
#
# There is insufficient memory for the Java
Runtime Environment to continue.
# Native memory allocation (mmap) failed to
map 2060255232 bytes for committing reserved
memory.
# An error report file with more information
is saved as:
# /tmp/hs_err_pid2616.log
[FAILED]
етИіБЈДэЪЧвђЮЊФЌШЯЪЙгУЕФФкДцДѓаЁЮЊ2GЃЌащФтЛњУЛ
гаФЧУДЖрЕФПеМфаоИФВЮЪ§ЃК
vim /etc/elasticsearch/jvm.options
-Xms512m
-Xmx512m
дйДЮЦєЖЏ
/etc/init.d/elasticsearch start
ВщПДЗўЮёзДЬЌЃЌШчЙћгаБЈДэПЩвдШЅПДДэЮѓШежО less /var/log/elasticsearch/demon.log(ШежОЕФУћГЦЪЧ
вдМЏШКУћГЦУќУћЕФ)
ДДНЈПЊЛњздЦєЖЏЗўЮё
# chkconfig elasticsearch on |
зЂвтЪТЯю
ашвЊаоИФМИИіВЮЪ§ЃЌВЛШЛЦєЖЏЛсБЈДэ
vim /etc/security/limits.conf
дкФЉЮВзЗМгвдЯТФкШнЃЈelkЮЊЦєЖЏгУЛЇЃЌЕБШЛвВПЩвджИЖЈЮЊ*ЃЉ
elk soft nofile 65536
elk hard nofile 65536
elk soft nproc 2048
elk hard nproc 2048
elk soft memlock unlimited
elk hard memlock unlimited
МЬајдйаоИФвЛИіВЮЪ§
vim /etc/security/limits.d/90-nproc.conf
НЋРяУцЕФ1024ИФЮЊ2048ЃЈESзюЩйвЊЧѓЮЊ2048ЃЉ
* soft nproc 2048
СэЭтЛЙашзЂвтвЛИіЮЪЬтЃЈдкШежОЗЂЯжШчЯТФкШнЃЌ
етбљвВЛсЕМжТЦєЖЏЪЇАмЃЌетвЛЮЪЬтРЇШХСЫКмОУЃЉ
[2017-06-14T19:19:01,641][INFO ][o.e.b.Bootstrap
Checks
] [elk-1] bound or publishing to a non-loopback
or non-link-local address, enforcing bootstrap
checks
[2017-06-14T19:19:01,658][ERROR][o.e.b.Bootstrap
]
[elk-1] node validation exception
[1] bootstrap checks failed
[1]: system call filters failed to install;
check the logs and fix your configuration or
disable system call filters at your own risk
НтОіЃКаоИФХфжУЮФМўЃЌдкХфжУЮФМўЬэМгвЛЯюВЮЪ§
ЃЈФПЧАЛЙУЛУїАзДЫВЮЪ§ЕФзїгУЃЉ
vim /etc/elasticsearch/elasticsearch.yml
bootstrap.system_call_filter: false |
ЭЈЙ§фЏРРЦїЧыЧѓЯТ9200ЕФЖЫПкЃЌПДЯТЪЧЗёГЩЙІ
ЯШМьВщ9200ЖЫПкЪЧЗёЦ№РД
netstat -antp |grep 9200
tcp 0 0 :::9200 :::* LISTEN 2934/java
фЏРРЦїЗУЮЪВтЪдЪЧЗёе§ГЃЃЈвдЯТЮЊе§ГЃЃЉ
# curl http://127.0.0.1:9200/
{
"name" : "linux-node1",
"cluster_name" : "demon",
"cluster_uuid" : "kM0GMFrsQ8K_cl5Fn7BF-g",
"version" : {
"number" : "5.4.0",
"build_hash" : "780f8c4",
"build_date" : "2017-04-28T17:43:27.229Z",
"build_snapshot" : false,
"lucene_version" : "6.5.0"
},
"tagline" : "You Know, for Search"
} |
ШчКЮКЭelasticsearchНЛЛЅ
JavaAPI
RESTful API
Javascript,.Net,PHP,Perl,Python
РћгУAPIВщПДзДЬЌ
# curl -i -XGET 'localhost:9200/_count?pretty'
HTTP/1.1 200 OK
content-type: application/json; charset=UTF-8
content-length: 95
{
"count" : 0,
"_shards" : {
"total" : 0,
"successful" : 0,
"failed" : 0
}
} |
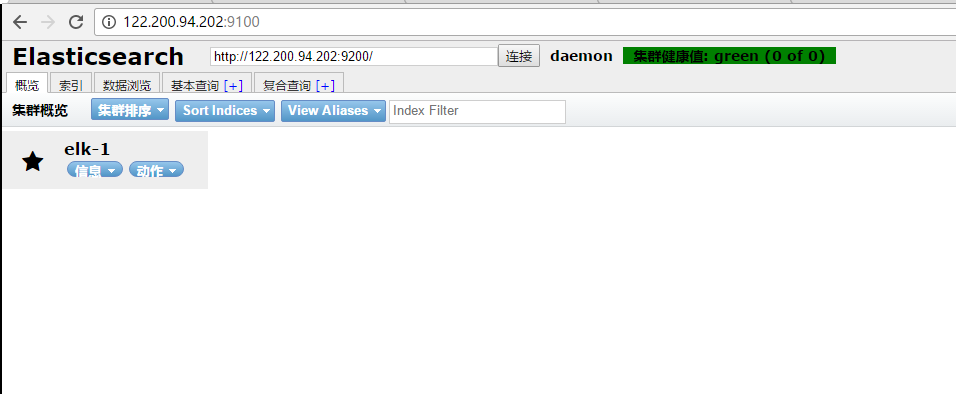
АВзАВхМў
АВзАelasticsearch-headВхМў
АВзАdockerОЕЯёЛђепЭЈЙ§githubЯТдиelasticsearch-headЯюФПЖМЪЧПЩвдЕФЃЌ1Лђеп2СНжжЗНЪНбЁдёвЛжжАВзАЪЙгУМДПЩ
1. ЪЙгУdockerЕФМЏГЩКУЕФelasticsearch-head
# docker run -p 9100:9100 mobz/elasticsearch-head:5
dockerШнЦїЯТдиГЩЙІВЂЦєЖЏвдКѓЃЌдЫаафЏРРЦїДђПЊhttp://localhost:9100/
2. ЪЙгУgitАВзАelasticsearch-head
# yum install -y npm
# git clone git://github.com/mobz/elasticsearch-head.git
# cd elasticsearch-head
# npm install
# npm run start
МьВщЖЫПкЪЧЗёЦ№РД
netstat -antp |grep 9100
фЏРРЦїЗУЮЪВтЪдЪЧЗёе§ГЃ
http://IP:9100/ |
LogStashЕФЪЙгУ
АВзАLogstashЛЗОГЃК
ЙйЗНАВзАЪжВс:
https://www.elastic.co/guide/en/logstash/current
/installing-logstash.html
ЯТдиyumдДЕФУмдПШЯжЄЃК
# rpm --import https://artifacts.elastic.co/GPG-KEY-elasticsearch
РћгУyumАВзАlogstash
# yum install -y logstash
ВщПДЯТlogstashЕФАВзАФПТМ
# rpm -ql logstash
ДДНЈвЛИіШэСЌНгЃЌУПДЮжДааУќСюЕФЪБКђВЛгУдкаДАВзАТЗОЂЃЈФЌШЯАВзАдк/usr/shareЯТЃЉ
ln -s /usr/share/logstash/bin/logstash /bin/
жДааlogstashЕФУќСю
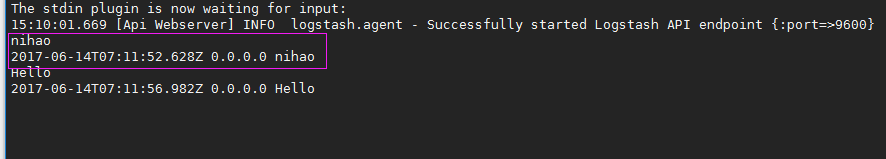
# logstash -e 'input { stdin { } } output {
stdout {} }'
дЫааГЩЙІвдКѓЪфШы:
nihao
stdoutЗЕЛиЕФНсЙћ: |
зЂ:
-e жДааВйзї
input БъзМЪфШы
{ input } ВхМў
output БъзМЪфГі
{ stdout } ВхМў
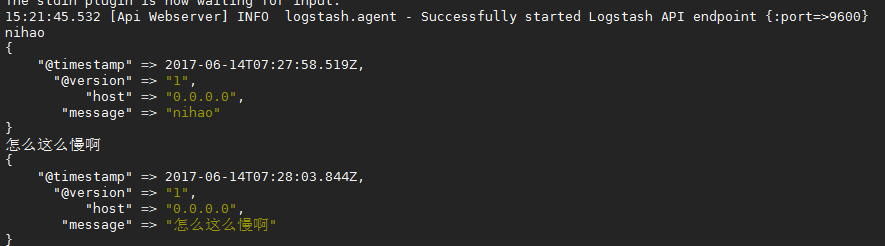
ЭЈЙ§rubydebugРДЪфГіЯТИќЯъЯИЕФаХЯЂ
# logstash -e 'input { stdin { } } output {
stdout {codec => rubydebug} }'
жДааГЩЙІЪфШы:
nihao
stdoutЪфГіЕФНсЙћ: |
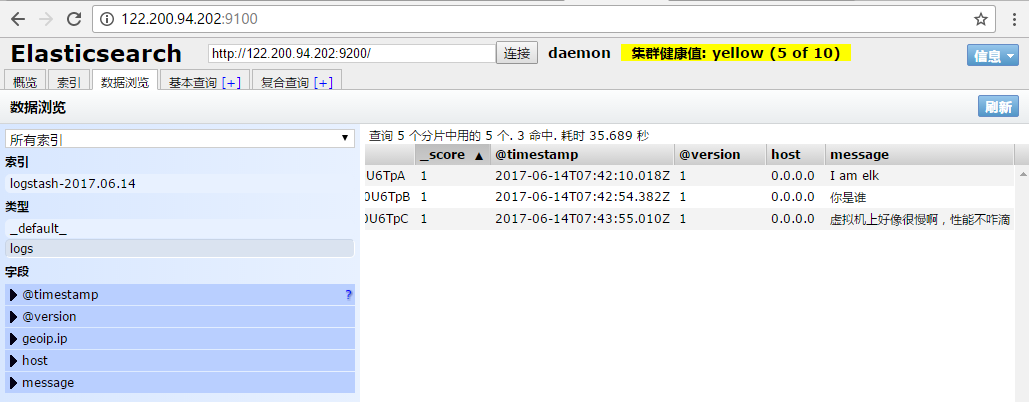
ШчЙћБъзМЪфГіЛЙгаelasticsearchжаЖМашвЊБЃСєгІИУдѕУДЭцЃЌПДЯТУц
ШчЙћБъзМЪфГіЛЙгаelasticsearchжаЖМашвЊБЃСєгІИУдѕУДЭцЃЌПДЯТУц
# /usr/share/logstash/bin/logstash -e 'input {
stdin { } } output { elasticsearch { hosts =>
["192.168.1.202:9200"] } stdout { codec
=> rubydebug }}'
дЫааГЩЙІвдКѓЪфШы:
I am elk
ЗЕЛиЕФНсЙћ(БъзМЪфГіжаЕФНсЙћ): |
logstashЪЙгУХфжУЮФМў
ЙйЗНжИФЯ:
https://www.elastic.co/guide/en/logstash/current/
configuration.html
ДДНЈХфжУЮФМў01-logstash.conf
# vim /etc/logstash/conf.d/elk.conf
ЮФМўжаЬэМгвдЯТФкШн
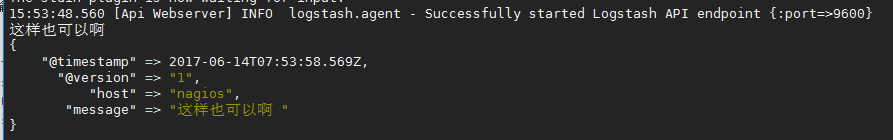
input { stdin { } }
output {
elasticsearch { hosts => ["192.168.1.202:9200"]
}
stdout { codec => rubydebug }
}
ЪЙгУХфжУЮФМўдЫааlogstash
# logstash -f ./elk.conf
дЫааГЩЙІвдКѓЪфШывдМАБъзМЪфГіНсЙћ |
logstashЕФЪ§ОнПтРраЭ
1. InputВхМў
ШЈЭўжИФЯ:https://www.elastic.co/guide/en/logstash/
current/input-plugins.html
fileВхМўЕФЪЙгУ
# vim /etc/logstash/conf.d/elk.conf
ЬэМгШчЯТХфжУ
input {
file {
path => "/var/log/messages"
type => "system"
start_position => "beginning"
}
}
output {
elasticsearch {
hosts => ["192.168.1.202:9200"]
index => "system-%{+YYYY.MM.dd}"
}
}
дЫааlogstashжИЖЈelk.confХфжУЮФМўЃЌНјааЙ§ТЫЦЅХф
#logstash -f /etc/logstash/conf.d/elk.conf
|

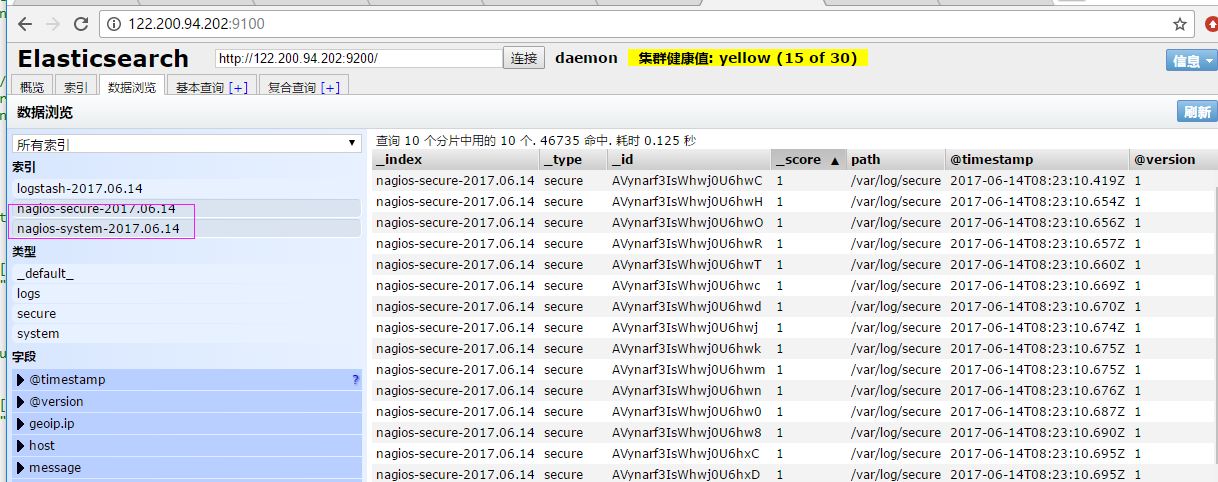
РДвЛЗЂХфжУАВШЋШежОЕФВЂЧвАбШежОЕФЫїв§АДРраЭзіДцЗХЃЌМЬајБрМelk.confЮФМў
# vim /etc/logstash/conf.d/elk.conf
ЬэМгsecureШежОЕФТЗОЖ
input {
file {
path => "/var/log/messages"
type => "system"
start_position => "beginning"
}
file {
path => "/var/log/secure"
type => "secure"
start_position => "beginning"
}
}
output {
if [type] == "system" {
elasticsearch {
hosts => ["192.168.1.202:9200"]
index => "nagios-system-%{+YYYY.MM.dd}"
}
}
if [type] == "secure" {
elasticsearch {
hosts => ["192.168.1.202:9200"]
index => "nagios-secure-%{+YYYY.MM.dd}"
}
}
}
дЫааlogstashжИЖЈelk.confХфжУЮФМўЃЌНјааЙ§ТЫЦЅХф
# logstash -f ./elk.conf
|
етаЉЩшжУЖМУЛгаЮЪЬтжЎКѓЃЌНгЯТРДАВзАЯТkibanaЃЌПЩвдШУдкЧАЬЈеЙЪО
KibanaЕФАВзАМАЪЙгУ
АВзАkibanaЛЗОГ
ЙйЗНАВзАЪжВс:https://www.elastic.co/guide/en/kibana
/current/install.html
ЯТдиkibanaЕФtar.gzЕФШэМўАќ
# wget https://artifacts.elastic.co/downloads/kibana
/kibana-5.4.0-linux-x86_64.tar.gz
НтбЙkibanaЕФtarАќ
# tar -xzf kibana-5.4.0-linux-x86_64.tar.gz
НјШыНтбЙКУЕФkibana
# mv kibana-5.4.0-linux-x86_64 /usr/local
ДДНЈkibanaЕФШэСЌНг
# ln -s /usr/local/kibana-5.4.0-linux-x86_64/
/usr/local/kibana
БрМkibanaЕФХфжУЮФМў
# vim /usr/local/kibana/config/kibana.yml
аоИФХфжУЮФМўШчЯТЃЌПЊЦєвдЯТЕФХфжУ
server.port: 5601
server.host: "0.0.0.0"
elasticsearch.url: "http://192.168.1.202:9200"
kibana.index: ".kibana"
АВзАscreen,вдБугкkibanaдкКѓЬЈдЫааЃЈЕБШЛвВПЩвдВЛ
гУАВзАЃЌгУЦфЫћЗНЪННјааКѓЬЈЦєЖЏЃЉ
# yum -y install screen
# screen
# /usr/local/kibana/bin/kibana
netstat -antp |grep 5601
tcp 0 0 0.0.0.0:5601 0.0.0.0:* LISTEN 17007/node
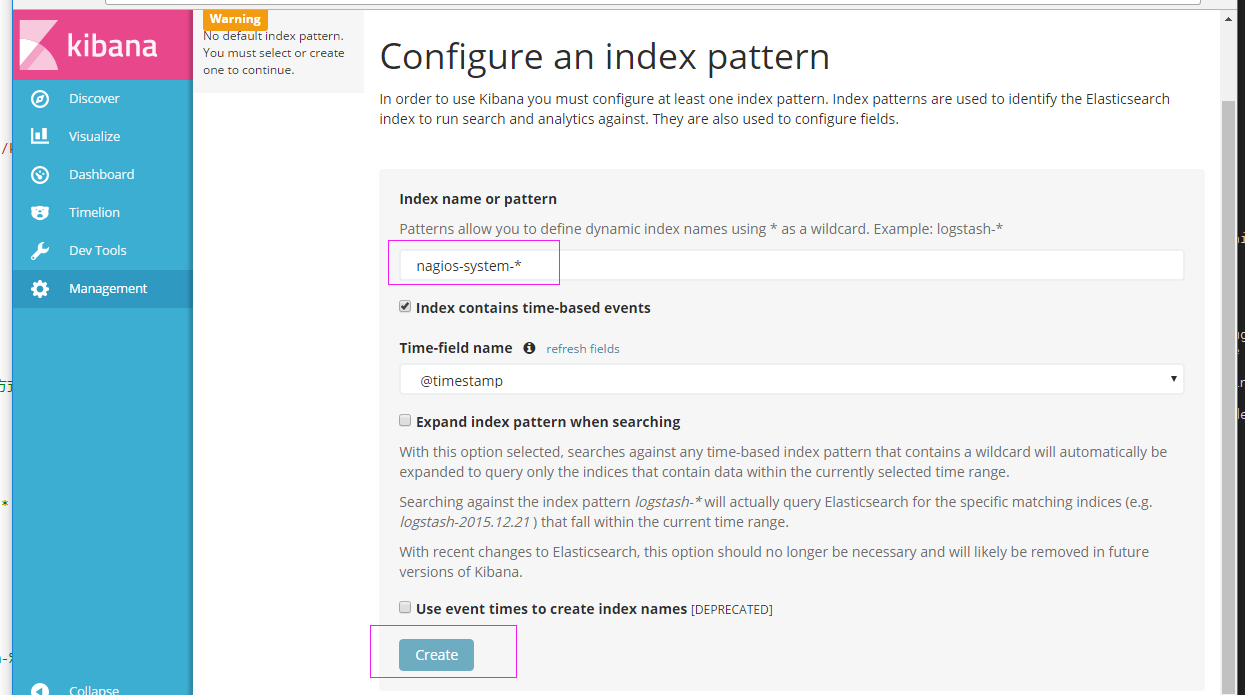
ДђПЊфЏРРЦїВЂЩшжУЖдгІЕФindex
http://IP:5601 |
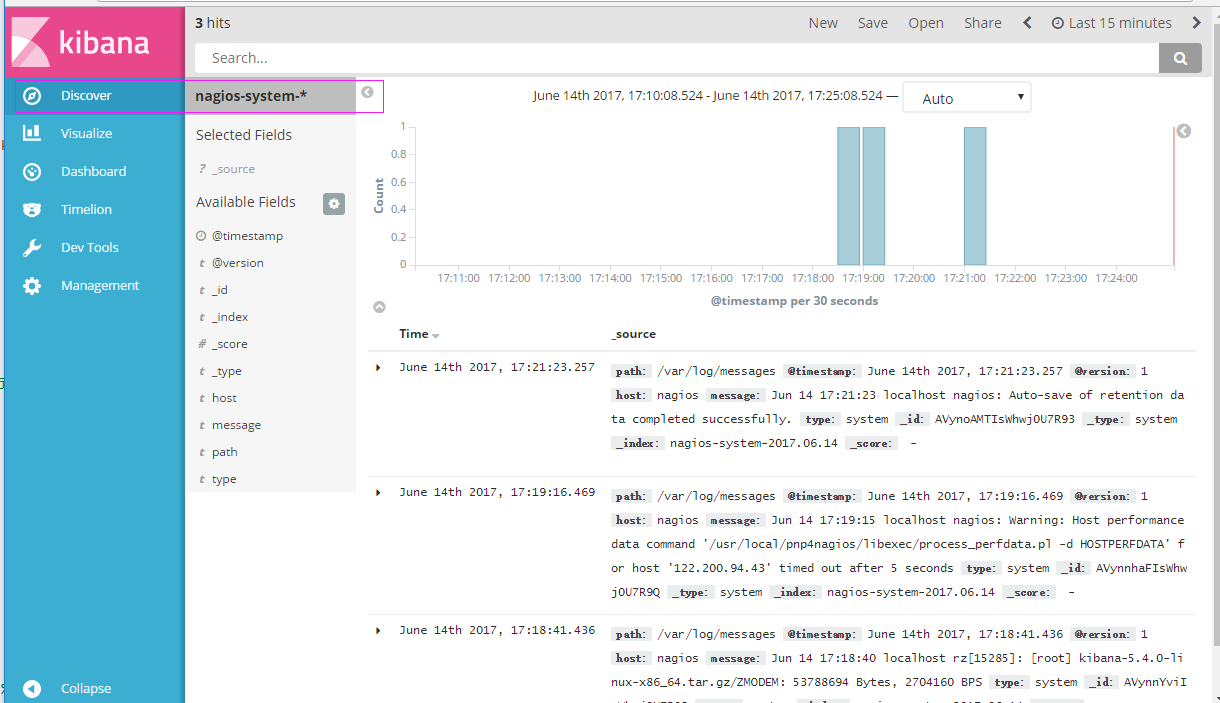
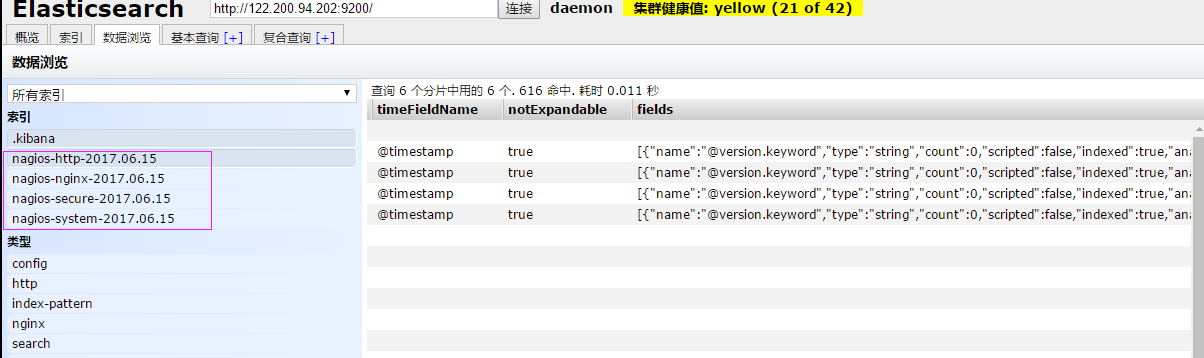
ЖўЁЂELKЪЕеНЦЊ
КУЃЌЯждкЫїв§вВПЩвдДДНЈСЫЃЌЯждкПЩвдРДЪфГіnginxЁЂapacheЁЂmessageЁЂsecrueЕФШежОЕНЧАЬЈеЙЪОЃЈNginxгаЕФЛАжБНгаоИФЃЌУЛгаздааАВзАЃЉ
БрМnginxХфжУЮФМўЃЌаоИФвдЯТФкШнЃЈдкhttpФЃПщЯТЬэМгЃЉ
log_format json '{"@timestamp":"$time_iso8601",'
'"@version":"1",'
'"client":"$remote_addr",'
'"url":"$uri",'
'"status":"$status",'
'"domian":"$host",'
'"host":"$server_addr",'
'"size":"$body_bytes_sent",'
'"responsetime":"$request_time",'
'"referer":"$http_referer",'
'"ua":"$http_user_agent"'
'}';
аоИФaccess_logЕФЪфГіИёЪНЮЊИеВХЖЈвхЕФjson
access_log logs/elk.access.log json;
МЬајаоИФapacheЕФХфжУЮФМў
LogFormat "{ \
\"@timestamp\": \"%{%Y-%m-%dT%H:%M:%S%z}t\",
\
\"@version\": \"1\", \
\"tags\":[\"apache\"], \
\"message\": \"%h %l %u %t \\\"%r\\\"
%>s %b\", \
\"clientip\": \"%a\", \
\"duration\": %D, \
\"status\": %>s, \
\"request\": \"%U%q\", \
\"urlpath\": \"%U\", \
\"urlquery\": \"%q\", \
\"bytes\": %B, \
\"method\": \"%m\", \
\"site\": \"%{Host}i\",
\
\"referer\": \"%{Referer}i\",
\
\"useragent\": \"%{User-agent}i\"
\
}" ls_apache_json
вЛбљаоИФЪфГіИёЪНЮЊЩЯУцЖЈвхЕФjsonИёЪН
CustomLog logs/access_log ls_apache_json
БрМlogstashХфжУЮФМўЃЌНјааШежОЪеМЏ
vim /etc/logstash/conf.d/full.conf
input {
file {
path => "/var/log/messages"
type => "system"
start_position => "beginning"
}
file {
path => "/var/log/secure"
type => "secure"
start_position => "beginning"
}
file {
path => "/var/log/httpd/access_log"
type => "http"
start_position => "beginning"
}
file {
path => "/usr/local/nginx/logs/elk.access.log"
type => "nginx"
start_position => "beginning"
}
}
output {
if [type] == "system" {
elasticsearch {
hosts => ["192.168.1.202:9200"]
index => "nagios-system-%{+YYYY.MM.dd}"
}
}
if [type] == "secure" {
elasticsearch {
hosts => ["192.168.1.202:9200"]
index => "nagios-secure-%{+YYYY.MM.dd}"
}
}
if [type] == "http" {
elasticsearch {
hosts => ["192.168.1.202:9200"]
index => "nagios-http-%{+YYYY.MM.dd}"
}
}
if [type] == "nginx" {
elasticsearch {
hosts => ["192.168.1.202:9200"]
index => "nagios-nginx-%{+YYYY.MM.dd}"
}
}
}
дЫааПДПДаЇЙћШчКЮ
logstash -f /etc/logstash/conf.d/full.conf |
ПЩвдЗЂЯжЫљгаДДНЈШежОЕФЫїв§ЖМвбДцдкЃЌНгЯТРДОЭШЅKibanaДДНЈШежОЫїв§ЃЌНјааеЙЪОЃЈАДееЩЯУцЕФЗНЗЈНјааДДНЈЫїв§МДПЩЃЉЃЌПДЯТеЙЪОЕФаЇЙћ
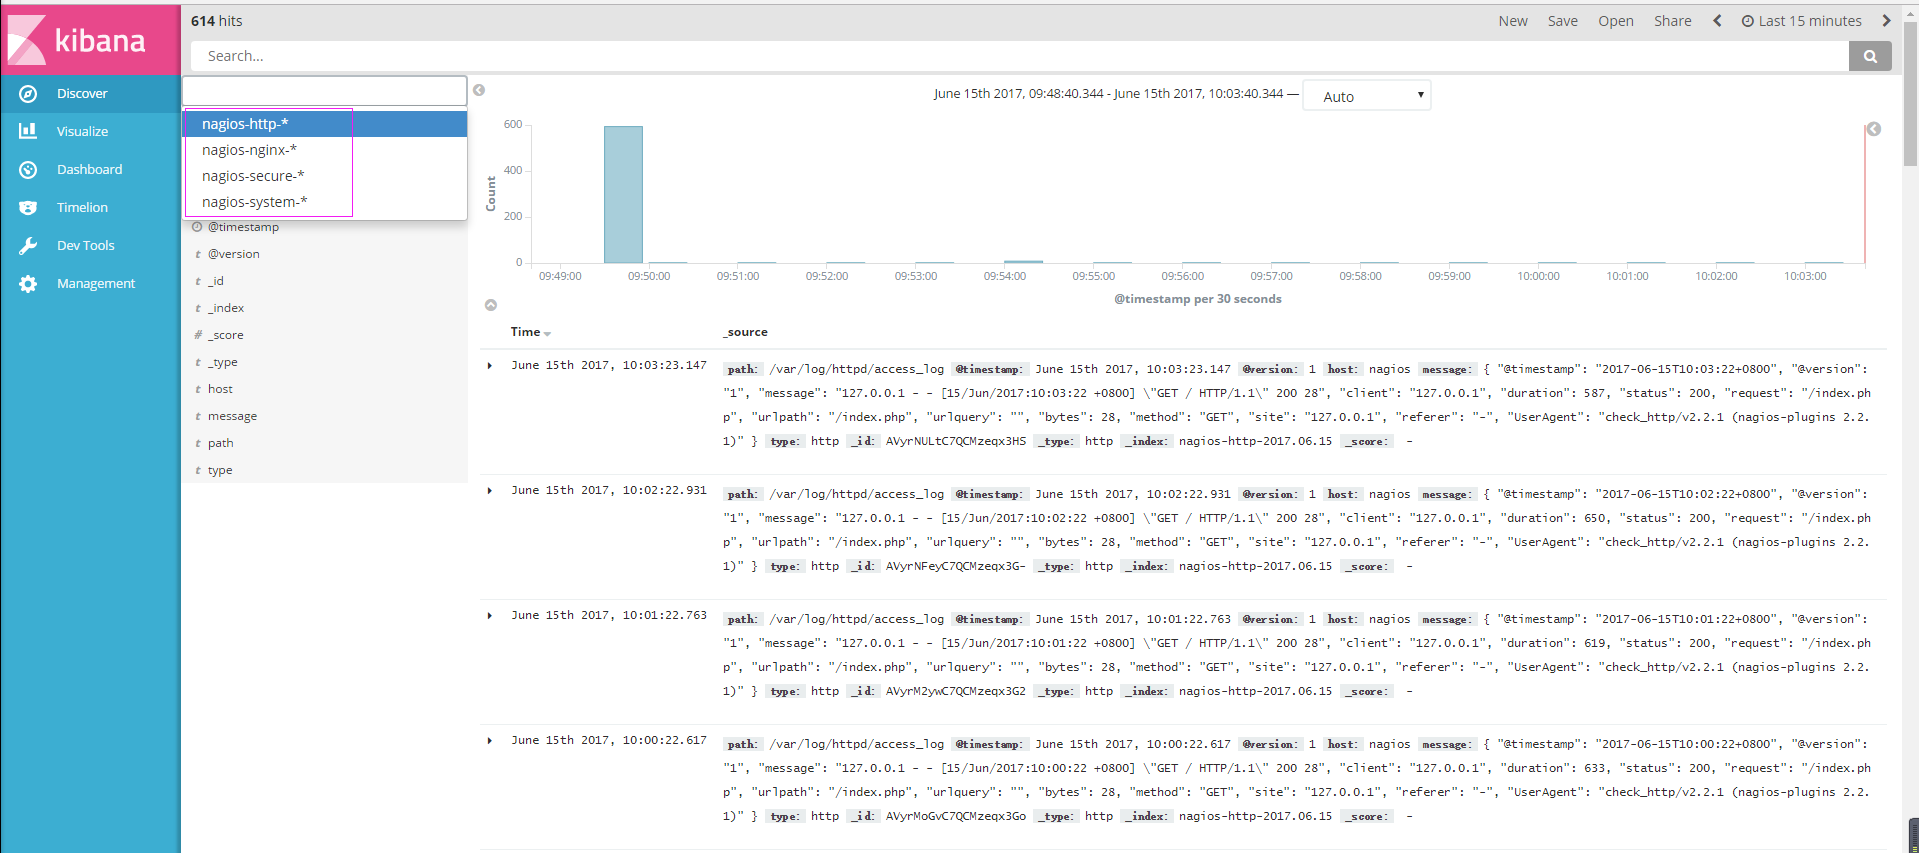
НгЯТРДдйРДвЛЗЂMySQLТ§ШежОЕФеЙЪО
гЩгкMySQLЕФТ§ШежОВщбЏИёЪНБШНЯЬиЪтЃЌЫљвдашвЊгУе§дђНјааЦЅХфЃЌВЂЪЙгУmultilineФмЙЛНјааЖрааЦЅХфЃЈПДОпЬхХфжУЃЉ
input {
file {
path => "/var/log/messages"
type => "system"
start_position => "beginning"
}
file {
path => "/var/log/secure"
type => "secure"
start_position => "beginning"
}
file {
path => "/var/log/httpd/access_log"
type => "http"
start_position => "beginning"
}
file {
path => "/usr/local/nginx/logs/elk.access.log"
type => "nginx"
start_position => "beginning"
}
file {
path => "/var/log/mysql/mysql.slow.log"
type => "mysql"
start_position => "beginning"
codec => multiline {
pattern => "^# User@Host:"
negate => true
what => "previous"
}
}
}
filter {
grok {
match => { "message" => "SELECT
SLEEP" }
add_tag => [ "sleep_drop" ]
tag_on_failure => []
}
if "sleep_drop" in [tags] {
drop {}
}
grok {
match => { "message" => "(?m)^#
User@Host: %{USER:User}
\[[^\]]+\] @ (?:(?<clienthost>\S*)
)?\[(?:%{IP:
Client_IP})?\]\s.*# Query_time:
%{NUMBER:Query_Time:float}\s+Lock_time: %{NUMBER:Lock_Time:float}\s+Rows_sent:
%{NUMBER:Rows_Sent:int}\s+Rows_examined: %{NUMBER:Rows_Examined:int}\s*(?:use
%{DATA:Database}
;\s*)?SET timestamp=%{NUMBER:timestamp};\s*(?<Query>
(?<Action>
\w+)\s+.*)\n#
Time:.*$" }
}
date {
match => [ "timestamp", "UNIX"
]
remove_field => [ "timestamp" ]
}
}
output {
if [type] == "system" {
elasticsearch {
hosts => ["192.168.1.202:9200"]
index => "nagios-system-%{+YYYY.MM.dd}"
}
}
if [type] == "secure" {
elasticsearch {
hosts => ["192.168.1.202:9200"]
index => "nagios-secure-%{+YYYY.MM.dd}"
}
}
if [type] == "http" {
elasticsearch {
hosts => ["192.168.1.202:9200"]
index => "nagios-http-%{+YYYY.MM.dd}"
}
}
if [type] == "nginx" {
elasticsearch {
hosts => ["192.168.1.202:9200"]
index => "nagios-nginx-%{+YYYY.MM.dd}"
}
}
if [type] == "mysql" {
elasticsearch {
hosts => ["192.168.1.202:9200"]
index => "nagios-mysql-slow-%{+YYYY.MM.dd}"
}
}
} |
ВщПДаЇЙћ(вЛЬѕТ§ШежОВщбЏЛсЯдЪОвЛЬѕЃЌШчЙћВЛНјаае§дђЦЅХфЃЌФЧУДвЛааОЭЛсЯдЪОвЛЬѕ)
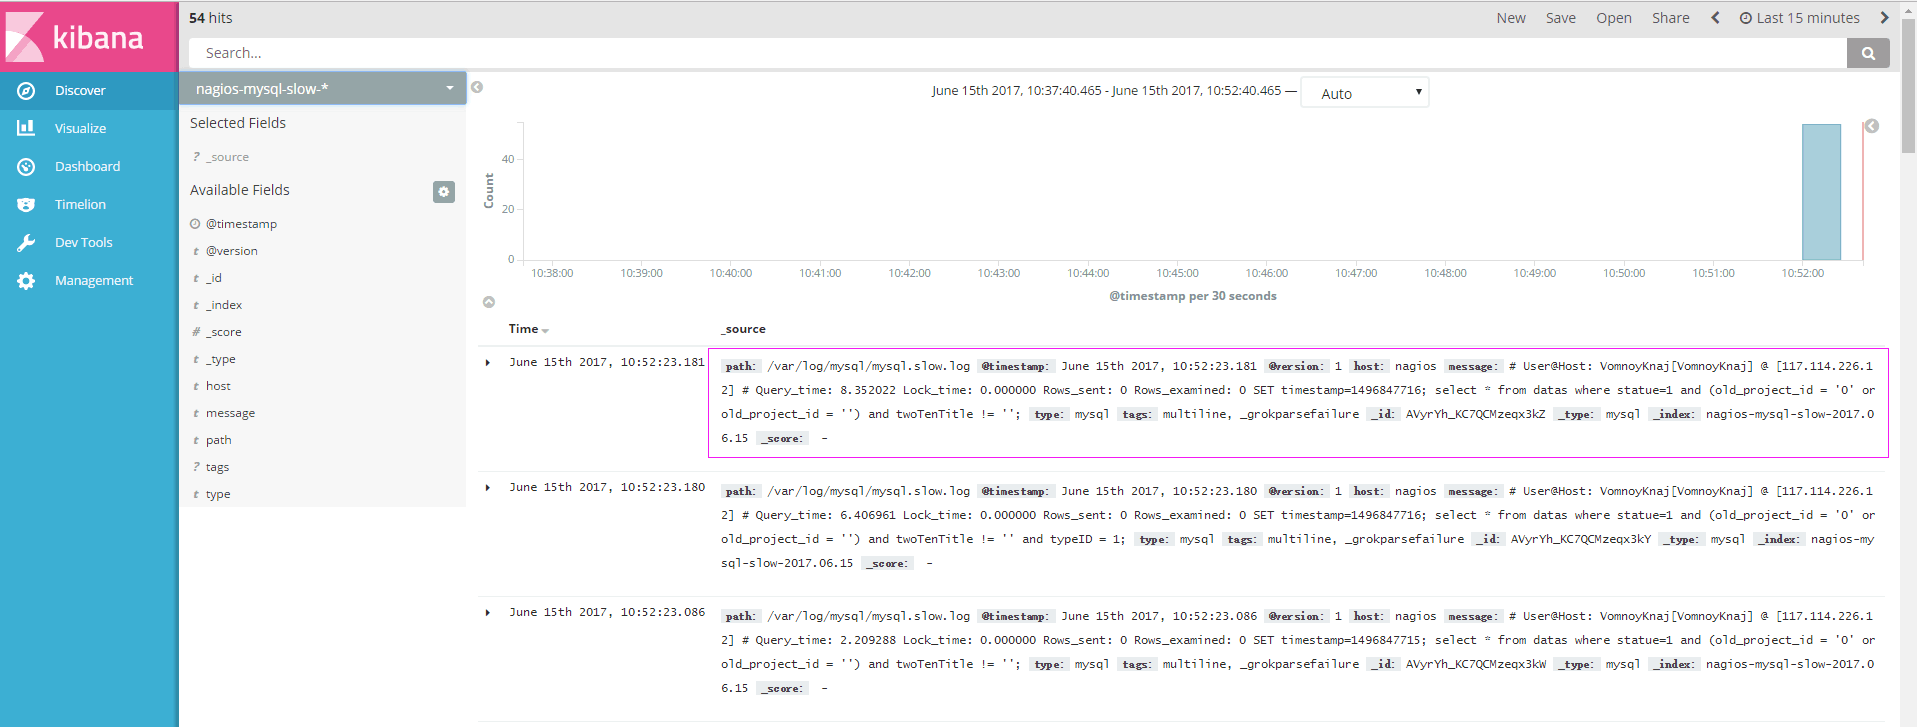
ОпЬхЕФШежОЪфГіашЧѓЃЌНјааОпЬхЕФЗжЮі
Ш§ЃКELKжеМЋЦЊ
АВзАreids
# yum install -y redis
аоИФredisЕФХфжУЮФМў
# vim /etc/redis.conf
аоИФФкШнШчЯТ
daemonize yes
bind 192.168.1.202
ЦєЖЏredisЗўЮё
# /etc/init.d/redis restart
ВтЪдredisЕФЪЧЗёЦєгУГЩЙІ
# redis-cli -h 192.168.1.202
ЪфШыinfoШчЙћгаВЛБЈДэМДПЩ
redis 192.168.1.202:6379> info
redis_version:2.4.10
....
БрМХфжУredis-out.confХфжУЮФМўЃЌАбБъзМЪфШыЕФЪ§ОнДцДЂЕНredisжа
# vim /etc/logstash/conf.d/redis-out.conf
ЬэМгШчЯТФкШн
input {
stdin {}
}
output {
redis {
host => "192.168.1.202"
port => "6379"
password => 'test'
db => '1'
data_type => "list"
key => 'elk-test'
}
}
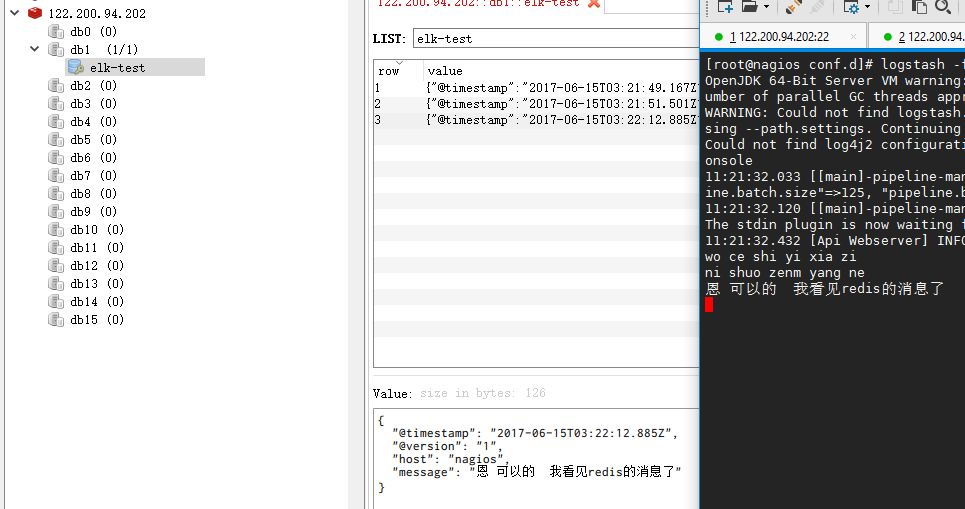
дЫааlogstashжИЖЈredis-out.confЕФХфжУЮФМў
# /usr/share/logstash/bin/logstash -f /etc/logstash/conf.d/redis-out.conf |
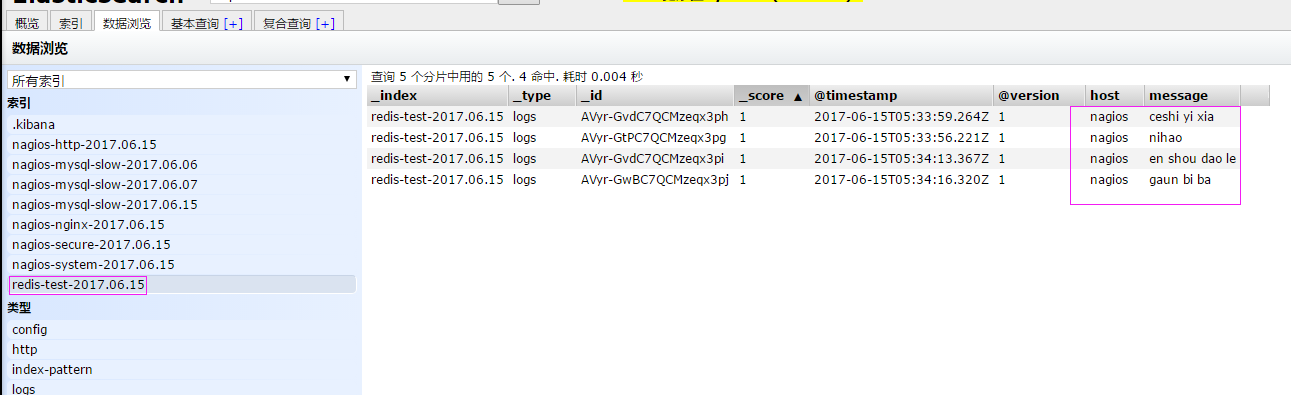
дЫааГЩЙІвдКѓЃЌдкlogstashжаЪфШыФкШнЃЈВщПДЯТаЇЙћЃЉ
БрМХфжУredis-in.confХфжУЮФМўЃЌАбreidsЕФДцДЂЕФЪ§ОнЪфГіЕНelasticsearchжа
# vim /etc/logstash/conf.d/redis-out.conf
ЬэМгШчЯТФкШн
input{
redis {
host => "192.168.1.202"
port => "6379"
password => 'test'
db => '1'
data_type => "list"
key => 'elk-test'
batch_count => 1 #етИіжЕЪЧжИДгЖгСажаЖСШЁЪ§ОнЪБЃЌвЛДЮадШЁГіЖрЩйЬѕЃЌФЌШЯ125ЬѕЃЈШчЙћredisжаУЛга125ЬѕЃЌОЭЛсБЈДэЃЌЫљвддкВтЪдЦкМфМгЩЯетИіжЕЃЉ
}
}
output {
elasticsearch {
hosts => ['192.168.1.202:9200']
index => 'redis-test-%{+YYYY.MM.dd}'
}
}
дЫааlogstashжИЖЈredis-in.confЕФХфжУЮФМў
# /usr/share/logstash/bin/logstash -f /etc/logstash/conf.d/redis-out.conf |
АбжЎЧАЕФХфжУЮФМўаоИФвЛЯТЃЌБфГЩЫљгаЕФШежОМрПиЕФРДдДЮФМўЖМДцЗХЕНredisжаЃЌШЛКѓЭЈЙ§redisдкЪфГіЕНelasticsearchжа
ИќИФЮЊШчЯТЃЌБрМfull.conf
input {
file {
path => "/var/log/httpd/access_log"
type => "http"
start_position => "beginning"
}
file {
path => "/usr/local/nginx/logs/elk.access.log"
type => "nginx"
start_position => "beginning"
}
file {
path => "/var/log/secure"
type => "secure"
start_position => "beginning"
}
file {
path => "/var/log/messages"
type => "system"
start_position => "beginning"
}
}
output {
if [type] == "http" {
redis {
host => "192.168.1.202"
password => 'test'
port => "6379"
db => "6"
data_type => "list"
key => 'nagios_http'
}
}
if [type] == "nginx" {
redis {
host => "192.168.1.202"
password => 'test'
port => "6379"
db => "6"
data_type => "list"
key => 'nagios_nginx'
}
}
if [type] == "secure" {
redis {
host => "192.168.1.202"
password => 'test'
port => "6379"
db => "6"
data_type => "list"
key => 'nagios_secure'
}
}
if [type] == "system" {
redis {
host => "192.168.1.202"
password => 'test'
port => "6379"
db => "6"
data_type => "list"
key => 'nagios_system'
}
}
}
дЫааlogstashжИЖЈshipper.confЕФХфжУЮФМў
# /usr/share/logstash/bin/logstash -f /etc/logstash/conf.d/full.conf
|
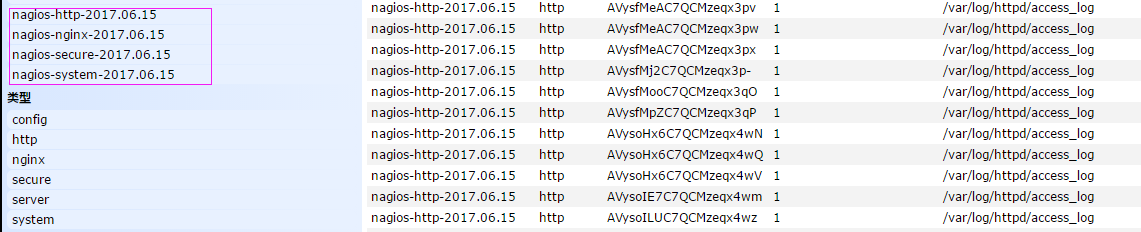
дкredisжаВщПДЪЧЗёвбОНЋЪ§ОнаДЕНРяУц(гаЪБКђЪфШыЕФШежОЮФМўВЛВњЩњШежОЃЌЛсЕМжТredisРяУцвВУЛгааДШыШежО)
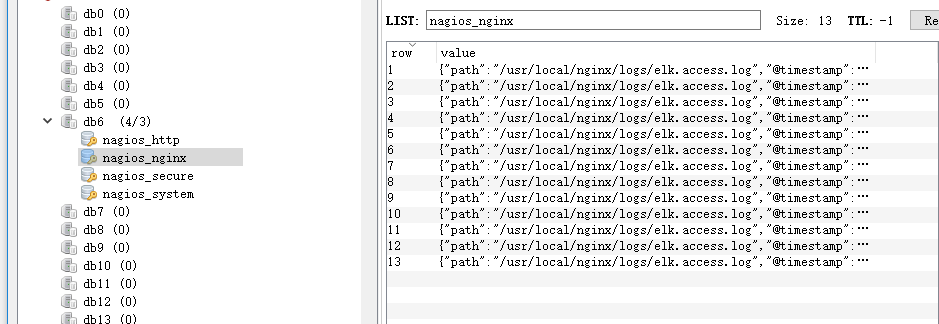
АбredisжаЕФЪ§ОнЖСШЁГіРДЃЌаДШыЕНelasticsearchжа(ашвЊСэЭтвЛЬЈжїЛњзіЪЕбщ)
БрМХфжУЮФМў
# vim /etc/logstash/conf.d/redis-out.conf
ЬэМгШчЯТФкШн
input {
redis {
type => "system"
host => "192.168.1.202"
password => 'test'
port => "6379"
db => "6"
data_type => "list"
key => 'nagios_system'
batch_count => 1
}
redis {
type => "http"
host => "192.168.1.202"
password => 'test'
port => "6379"
db => "6"
data_type => "list"
key => 'nagios_http'
batch_count => 1
}
redis {
type => "nginx"
host => "192.168.1.202"
password => 'test'
port => "6379"
db => "6"
data_type => "list"
key => 'nagios_nginx'
batch_count => 1
}
redis {
type => "secure"
host => "192.168.1.202"
password => 'test'
port => "6379"
db => "6"
data_type => "list"
key => 'nagios_secure'
batch_count => 1
}
}
output {
if [type] == "system" {
elasticsearch {
hosts => ["192.168.1.202:9200"]
index => "nagios-system-%{+YYYY.MM.dd}"
}
}
if [type] == "http" {
elasticsearch {
hosts => ["192.168.1.202:9200"]
index => "nagios-http-%{+YYYY.MM.dd}"
}
}
if [type] == "nginx" {
elasticsearch {
hosts => ["192.168.1.202:9200"]
index => "nagios-nginx-%{+YYYY.MM.dd}"
}
}
if [type] == "secure" {
elasticsearch {
hosts => ["192.168.1.202:9200"]
index => "nagios-secure-%{+YYYY.MM.dd}"
}
}
} |
зЂвт:
inputЪЧДгПЭЛЇЖЫЪеМЏЕФ
outputЪЧЭЌбљвВБЃДцЕН192.168.1.202жаЕФelasticsearchжаЃЌШчЙћвЊБЃДцЕНЕБЧАЕФжїЛњЩЯЃЌПЩвдАбoutputжаЕФhostsаоИФГЩlocalhostЃЌШчЙћЛЙашвЊдкkibanaжаЯдЪОЃЌашвЊдкБОЛњЩЯВПЪ№kabanaЃЌЮЊКЮвЊетбљзіЃЌЦ№ЕНвЛИіЫЩёюКЯЕФФПЕФ
ЫЕАзСЫЃЌОЭЪЧдкПЭЛЇЖЫЪеМЏШежОЃЌаДЕНЗўЮёЖЫЕФredisРяЛђЪЧБОЕиЕФredisРяУцЃЌЪфГіЕФЪБКђЖдНгESЗўЮёЦїМДПЩ
дЫааУќСюПДПДаЇЙћ
| # /usr/share/logstash/bin/logstash
-f /etc/logstash/conf.d/redis-out.conf |
аЇЙћЪЧКЭжБНгЭљESЗўЮёЦїЪфГівЛбљЕФЃЈетбљЪЧЯШНЋШежОДцЕНredisЪ§ОнПтЃЌШЛКѓдйДгredisЪ§ОнПтРяШЁГіШежОЃЉ
ЩЯЯпELK
вђЮЊESБЃДцШежОЪЧгРОУБЃДцЃЌЫљвдашвЊЖЈЦкЩОГ§вЛЯТШежОЃЌЯТУцУќСюЮЊЩОГ§жИЖЈЪБМфЧАЕФШежО
curl -X DELETE
http://xx.xx.com:9200/
logstash-*-`date +%Y-%m-%d
-d "-$n days"` |
|