| БрМЭЦМі: |
БОЮФжївЊНщЩмzabbixМрПиNginxЁЂ
TomcatЁЂMySQLЃЌЦфШчКЮХфжУЮФМўШчКЮМрПиЃЌЯЃЭћЖдФњЕФбЇЯАгаЫљАяжњЁЃ
БОЮФРДздгкCSDNЃЌгЩЛ№СњЙћШэМўAliceБрМЁЂЭЦМіЁЃ |
|
zabbixМрПиNginx
AЛњЦїЃКzabbixЗўЮёЖЫЃЈ192.168.234.128ЃЉ
BЛњЦїЃКzabbixПЭЛЇЖЫЃЈ192.168.234.125ЃЉ
дкBЛњЦїЃЈzabbixПЭЛЇЖЫЃЉВйзїЃК
БрМnginxащФтжїЛњХфжУЮФМўЃК
| [root@centos ~]#
vi /etc/nginx/conf.d/default.conf |
дкserver{}жаЬэМгвдЯТФкШнЃК
location /nginx_status
{
stub_status on;
access_log off;
allow 127.0.0.1;
deny all;
} |
жидиnginxХфжУЃК
| [root@centos ~]#
nginx -s reload |
ВтЪдЃК
[root@centos ~]#
curl http://127.0.0.1/nginx_status
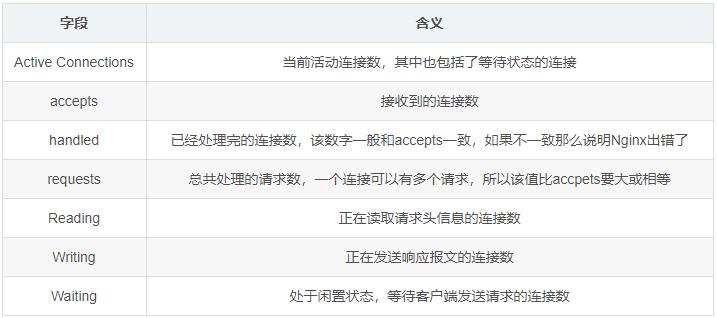
Active connections: 1
server accepts handled requests
3 3 3
Reading: 0 Writing: 1 Waiting: 0 |
#nginxзДЬЌаХЯЂвбЯдЪО
зДЬЌЫЕУїЃК
ЬэМгМрПиНХБО:
| vi /usr/local/sbin/ngx_status.sh |
ЬэМгвдЯТФкШнЃК
#!/bin/bash
url="http://127.0.0.1/nginx_status"
curl=/usr/bin/curl
# МьВтnginxНјГЬЪЧЗёДцдк
function ping {
/sbin/pidof nginx | wc -l
}
# МьВтnginxадФм
function active {
$curl $url 2>/dev/null| grep 'Active' | awk
'{print $NF}'
}
function reading {
$curl $url 2>/dev/null| grep 'Reading' | awk
'{print $2}'
}
function writing {
$curl $url 2>/dev/null| grep 'Writing' | awk
'{print $4}'
}
function waiting {
$curl $url 2>/dev/null| grep 'Waiting' | awk
'{print $6}'
}
function accepts {
$curl $url 2>/dev/null| awk NR==3 | awk '{print
$1}'
}
function handled {
$curl $url 2>/dev/null| awk NR==3 | awk '{print
$2}'
}
function requests {
$curl $url 2>/dev/null| awk NR==3 | awk '{print
$3}'
}
$1 |
ЬэМгШЈЯоЃК
| [root@centos ~]#
chmod 755 /usr/local/sbin/ngx_status.sh |
БрМzabbix_agentХфжУЮФМўЃК
| [root@centos ~]#
vi /etc/zabbix/zabbix_agentd.conf |
дкOptionЃКUserParameterДІЬэМгЃК
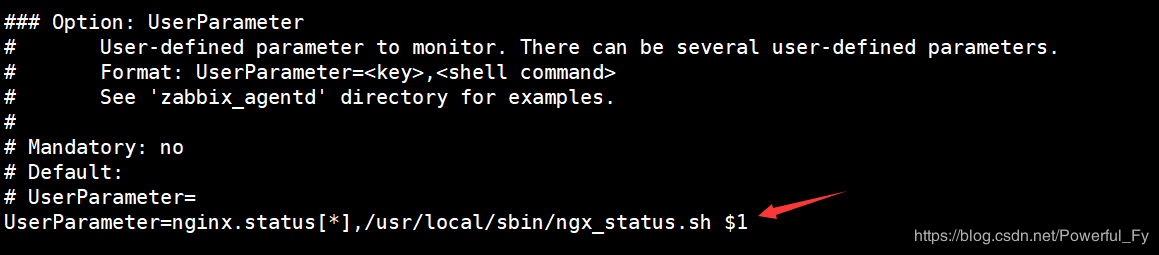
жиЦєЗўЮёЃК
| [root@centos ~]#
systemctl restart zabbix-agent |
дкAЛњЦїЃЈЗўЮёЖЫЃЉВтЪдЃК
[root@zabbix ~]#
zabbix_get -s 192.168.234.125 -k 'nginx.status[accepts]'
6 |
дкБОЛњДДНЈ.xmlЮФМўВЂЬэМгвдЯТФкШнЃКЃЈЮФМўУћГЦздЖЈвхЃЉ
<?xml version="1.0"
encoding="UTF-8"?>
<zabbix_export>
<version>4.0</version>
<date>2019-02-11T07:29:29Z</date>
<groups>
<group>
<name>Templates</name>
</group>
</groups>
<templates>
<template>
<template>Template
App NGINX</template>
<name>Template
App NGINX</name>
<description/>
<groups>
<group>
<name>Templates</name>
</group>
</groups>
<applications>
<application>
<name>nginx</name>
</application>
</applications>
<items>
<item>
<name>nginx
status server accepts</name>
<type>0</type>
<snmp_community/>
<snmp_oid/>
<key>nginx.status[accepts]</key>
<delay>60</delay>
<history>90d</history>
<trends>365d</trends>
<status>0</status>
<value_type>3</value_type>
<allowed_hosts/>
<units/>
<snmpv3_contextname/>
<snmpv3_securityname/>
<snmpv3_securitylevel>0</snmpv3_securitylevel>
<snmpv3_authprotocol>0</snmpv3_authprotocol>
<snmpv3_authpassphrase/>
<snmpv3_privprotocol>0</snmpv3_privprotocol>
<snmpv3_privpassphrase/>
<params/>
<ipmi_sensor/>
<authtype>0</authtype>
<username/>
<password/>
<publickey/>
<privatekey/>
<port/>
<description>accepts</description>
<inventory_link>0</inventory_link>
<applications>
<application>
<name>nginx</name>
</application>
</applications>
<valuemap/>
<logtimefmt/>
<preprocessing>
<step>
<type>10</type>
<params/>
</step>
</preprocessing>
<jmx_endpoint/>
<timeout>3s</timeout>
<url/>
<query_fields/>
<posts/>
<status_codes>200</status_codes>
<follow_redirects>1</follow_redirects>
<post_type>0</post_type>
<http_proxy/>
<headers/>
<retrieve_mode>0</retrieve_mode>
<request_method>0</request_method>
<output_format>0</output_format>
<allow_traps>0</allow_traps>
<ssl_cert_file/>
<ssl_key_file/>
<ssl_key_password/>
<verify_peer>0</verify_peer>
<verify_host>0</verify_host>
<master_item/>
</item>
<item>
<name>nginx status connections active</name>
<type>0</type>
<snmp_community/>
<snmp_oid/>
<key>nginx.status[active]</key>
<delay>60</delay>
<history>90d</history>
<trends>365d</trends>
<status>0</status>
<value_type>3</value_type>
<allowed_hosts/>
<units/>
<snmpv3_contextname/>
<snmpv3_securityname/>
<snmpv3_securitylevel>0</snmpv3_securitylevel>
<snmpv3_authprotocol>0</snmpv3_authprotocol>
<snmpv3_authpassphrase/>
<snmpv3_privprotocol>0</snmpv3_privprotocol>
<snmpv3_privpassphrase/>
<params/>
<ipmi_sensor/>
<authtype>0</authtype>
<username/>
<password/>
<publickey/>
<privatekey/>
<port/>
<description>active</description>
<inventory_link>0</inventory_link>
<applications>
<application>
<name>nginx</name>
</application>
</applications>
<valuemap/>
<logtimefmt/>
<preprocessing/>
<jmx_endpoint/>
<timeout>3s</timeout>
<url/>
<query_fields/>
<posts/>
<status_codes>200</status_codes>
<follow_redirects>1</follow_redirects>
<post_type>0</post_type>
<http_proxy/>
<headers/>
<retrieve_mode>0</retrieve_mode>
<request_method>0</request_method>
<output_format>0</output_format>
<allow_traps>0</allow_traps>
<ssl_cert_file/>
<ssl_key_file/>
<ssl_key_password/>
<verify_peer>0</verify_peer>
<verify_host>0</verify_host>
<master_item/>
</item>
<item>
<name>nginx status server handled</name>
<type>0</type>
<snmp_community/>
<snmp_oid/>
<key>nginx.status[handled]</key>
<delay>60</delay>
<history>90d</history>
<trends>365d</trends>
<status>0</status>
<value_type>3</value_type>
<allowed_hosts/>
<units/>
<snmpv3_contextname/>
<snmpv3_securityname/>
<snmpv3_securitylevel>0</snmpv3_securitylevel>
<snmpv3_authprotocol>0</snmpv3_authprotocol>
<snmpv3_authpassphrase/>
<snmpv3_privprotocol>0</snmpv3_privprotocol>
<snmpv3_privpassphrase/>
<params/>
<ipmi_sensor/>
<authtype>0</authtype>
<username/>
<password/>
<publickey/>
<privatekey/>
<port/>
<description>handled</description>
<inventory_link>0</inventory_link>
<applications>
<application>
<name>nginx</name>
</application>
</applications>
<valuemap/>
<logtimefmt/>
<preprocessing>
<step>
<type>10</type>
<params/>
</step>
</preprocessing>
<jmx_endpoint/>
<timeout>3s</timeout>
<url/>
<query_fields/>
<posts/>
<status_codes>200</status_codes>
<follow_redirects>1</follow_redirects>
<post_type>0</post_type>
<http_proxy/>
<headers/>
<retrieve_mode>0</retrieve_mode>
<request_method>0</request_method>
<output_format>0</output_format>
<allow_traps>0</allow_traps>
<ssl_cert_file/>
<ssl_key_file/>
<ssl_key_password/>
<verify_peer>0</verify_peer>
<verify_host>0</verify_host>
<master_item/>
</item>
<item>
<name>nginx status PING</name>
<type>0</type>
<snmp_community/>
<snmp_oid/>
<key>nginx.status[ping]</key>
<delay>60</delay>
<history>30d</history>
<trends>365d</trends>
<status>0</status>
<value_type>3</value_type>
<allowed_hosts/>
<units/>
<snmpv3_contextname/>
<snmpv3_securityname/>
<snmpv3_securitylevel>0</snmpv3_securitylevel>
<snmpv3_authprotocol>0</snmpv3_authprotocol>
<snmpv3_authpassphrase/>
<snmpv3_privprotocol>0</snmpv3_privprotocol>
<snmpv3_privpassphrase/>
<params/>
<ipmi_sensor/>
<authtype>0</authtype>
<username/>
<password/>
<publickey/>
<privatekey/>
<port/>
<description>is
live</description>
<inventory_link>0</inventory_link>
<applications>
<application>
<name>nginx</name>
</application>
</applications>
<valuemap>
<name>Service state</name>
</valuemap>
<logtimefmt/>
<preprocessing/>
<jmx_endpoint/>
<timeout>3s</timeout>
<url/>
<query_fields/>
<posts/>
<status_codes>200</status_codes>
<follow_redirects>1</follow_redirects>
<post_type>0</post_type>
<http_proxy/>
<headers/>
<retrieve_mode>0</retrieve_mode>
<request_method>0</request_method>
<output_format>0</output_format>
<allow_traps>0</allow_traps>
<ssl_cert_file/>
<ssl_key_file/>
<ssl_key_password/>
<verify_peer>0</verify_peer>
<verify_host>0</verify_host>
<master_item/>
</item>
<item>
<name>nginx status connections reading</name>
<type>0</type>
<snmp_community/>
<snmp_oid/>
<key>nginx.status[reading]</key>
<delay>60</delay>
<history>90d</history>
<trends>365d</trends>
<status>0</status>
<value_type>3</value_type>
<allowed_hosts/>
<units/>
<snmpv3_contextname/>
<snmpv3_securityname/>
<snmpv3_securitylevel>0</snmpv3_securitylevel>
<snmpv3_authprotocol>0</snmpv3_authprotocol>
<snmpv3_authpassphrase/>
<snmpv3_privprotocol>0</snmpv3_privprotocol>
<snmpv3_privpassphrase/>
<params/>
<ipmi_sensor/>
<authtype>0</authtype>
<username/>
<password/>
<publickey/>
<privatekey/>
<port/>
<description>reading</description>
<inventory_link>0</inventory_link>
<applications>
<application>
<name>nginx</name>
</application>
</applications>
<valuemap/>
<logtimefmt/>
<preprocessing/>
<jmx_endpoint/>
<timeout>3s</timeout>
<url/>
<query_fields/>
<posts/>
<status_codes>200</status_codes>
<follow_redirects>1</follow_redirects>
<post_type>0</post_type>
<http_proxy/>
<headers/>
<retrieve_mode>0</retrieve_mode>
<request_method>0</request_method>
<output_format>0</output_format>
<allow_traps>0</allow_traps>
<ssl_cert_file/>
<ssl_key_file/>
<ssl_key_password/>
<verify_peer>0</verify_peer>
<verify_host>0</verify_host>
<master_item/>
</item>
<item>
<name>nginx status server requests</name>
<type>0</type>
<snmp_community/>
<snmp_oid/>
<key>nginx.status[requests]</key>
<delay>60</delay>
<history>90d</history>
<trends>365d</trends>
<status>0</status>
<value_type>3</value_type>
<allowed_hosts/>
<units/>
<snmpv3_contextname/>
<snmpv3_securityname/>
<snmpv3_securitylevel>0</snmpv3_securitylevel>
<snmpv3_authprotocol>0</snmpv3_authprotocol>
<snmpv3_authpassphrase/>
<snmpv3_privprotocol>0</snmpv3_privprotocol>
<snmpv3_privpassphrase/>
<params/>
<ipmi_sensor/>
<authtype>0</authtype>
<username/>
<password/>
<publickey/>
<privatekey/>
<port/>
<description>requests</description>
<inventory_link>0</inventory_link>
<applications>
<application>
<name>nginx</name>
</application>
</applications>
<valuemap/>
<logtimefmt/>
<preprocessing>
<step>
<type>10</type>
<params/>
</step>
</preprocessing>
<jmx_endpoint/>
<timeout>3s</timeout>
<url/>
<query_fields/>
<posts/>
<status_codes>200</status_codes>
<follow_redirects>1</follow_redirects>
<post_type>0</post_type>
<http_proxy/>
<headers/>
<retrieve_mode>0</retrieve_mode>
<request_method>0</request_method>
<output_format>0</output_format>
<allow_traps>0</allow_traps>
<ssl_cert_file/>
<ssl_key_file/>
<ssl_key_password/>
<verify_peer>0</verify_peer>
<verify_host>0</verify_host>
<master_item/>
</item>
<item>
<name>nginx status connections waiting</name>
<type>0</type>
<snmp_community/>
<snmp_oid/>
<key>nginx.status[waiting]</key>
<delay>60</delay>
<history>90d</history>
<trends>365d</trends>
<status>0</status>
<value_type>3</value_type>
<allowed_hosts/>
<units/>
<snmpv3_contextname/>
<snmpv3_securityname/>
<snmpv3_securitylevel>0</snmpv3_securitylevel>
<snmpv3_authprotocol>0</snmpv3_authprotocol>
<snmpv3_authpassphrase/>
<snmpv3_privprotocol>0</snmpv3_privprotocol>
<snmpv3_privpassphrase/>
<params/>
<ipmi_sensor/>
<authtype>0</authtype>
<username/>
<password/>
<publickey/>
<privatekey/>
<port/>
<description>waiting</description>
<inventory_link>0</inventory_link>
<applications>
<application>
<name>nginx</name>
</application>
</applications>
<valuemap/>
<logtimefmt/>
<preprocessing/>
<jmx_endpoint/>
<timeout>3s</timeout>
<url/>
<query_fields/>
<posts/>
<status_codes>200</status_codes>
<follow_redirects>1</follow_redirects>
<post_type>0</post_type>
<http_proxy/>
<headers/>
<retrieve_mode>0</retrieve_mode>
<request_method>0</request_method>
<output_format>0</output_format>
<allow_traps>0</allow_traps>
<ssl_cert_file/>
<ssl_key_file/>
<ssl_key_password/>
<verify_peer>0</verify_peer>
<verify_host>0</verify_host>
<master_item/>
</item>
<item>
<name>nginx status connections writing</name>
<type>0</type>
<snmp_community/>
<snmp_oid/>
<key>nginx.status[writing]</key>
<delay>60</delay>
<history>90d</history>
<trends>365d</trends>
<status>0</status>
<value_type>3</value_type>
<allowed_hosts/>
<units/>
<snmpv3_contextname/>
<snmpv3_securityname/>
<snmpv3_securitylevel>0</snmpv3_securitylevel>
<snmpv3_authprotocol>0</snmpv3_authprotocol>
<snmpv3_authpassphrase/>
<snmpv3_privprotocol>0</snmpv3_privprotocol>
<snmpv3_privpassphrase/>
<params/>
<ipmi_sensor/>
<authtype>0</authtype>
<username/>
<password/>
<publickey/>
<privatekey/>
<port/>
<description>writing</description>
<inventory_link>0</inventory_link>
<applications>
<application>
<name>nginx</name>
</application>
</applications>
<valuemap/>
<logtimefmt/>
<preprocessing/>
<jmx_endpoint/>
<timeout>3s</timeout>
<url/>
<query_fields/>
<posts/>
<status_codes>200</status_codes>
<follow_redirects>1</follow_redirects>
<post_type>0</post_type>
<http_proxy/>
<headers/>
<retrieve_mode>0</retrieve_mode>
<request_method>0</request_method>
<output_format>0</output_format>
<allow_traps>0</allow_traps>
<ssl_cert_file/>
<ssl_key_file/>
<ssl_key_password/>
<verify_peer>0</verify_peer>
<verify_host>0</verify_host>
<master_item/>
</item>
</items>
<discovery_rules/>
<httptests/>
<macros/>
<templates/>
<screens/>
</template>
</templates>
<triggers>
<trigger>
<expression>{Template
App NGINX:nginx
.status[ping].last()}=0</expression>
<recovery_mode>0</recovery_mode>
<recovery_expression/>
<name>nginx
was down!</name>
<correlation_mode>0</correlation_mode>
<correlation_tag/>
<url/>
<status>0</status>
<priority>4</priority>
<description>NGINXНјГЬЪ§ЃК0ЃЌЧызЂвт</description>
<type>0</type>
<manual_close>0</manual_close>
<dependencies/>
<tags/>
</trigger>
</triggers>
<graphs>
<graph>
<name>nginx status connections</name>
<width>900</width>
<height>200</height>
<yaxismin>0.0000</yaxismin>
<yaxismax>100.0000</yaxismax>
<show_work_period>1</show_work_period>
<show_triggers>1</show_triggers>
<type>0</type>
<show_legend>1</show_legend>
<show_3d>0</show_3d>
<percent_left>0.0000</percent_left>
<percent_right>0.0000</percent_right>
<ymin_type_1>0</ymin_type_1>
<ymax_type_1>0</ymax_type_1>
<ymin_item_1>0</ymin_item_1>
<ymax_item_1>0</ymax_item_1>
<graph_items>
<graph_item>
<sortorder>0</sortorder>
<drawtype>0</drawtype>
<color>00C800</color>
<yaxisside>0</yaxisside>
<calc_fnc>2</calc_fnc>
<type>0</type>
<item>
<host>Template App NGINX</host>
<key>nginx.status[active]</key>
</item>
</graph_item>
<graph_item>
<sortorder>1</sortorder>
<drawtype>0</drawtype>
<color>C80000</color>
<yaxisside>0</yaxisside>
<calc_fnc>2</calc_fnc>
<type>0</type>
<item>
<host>Template App NGINX</host>
<key>nginx.status[reading]</key>
</item>
</graph_item>
<graph_item>
<sortorder>2</sortorder>
<drawtype>0</drawtype>
<color>0000C8</color>
<yaxisside>0</yaxisside>
<calc_fnc>2</calc_fnc>
<type>0</type>
<item>
<host>Template App NGINX</host>
<key>nginx.status[waiting]</key>
</item>
</graph_item>
<graph_item>
<sortorder>3</sortorder>
<drawtype>0</drawtype>
<color>C800C8</color>
<yaxisside>0</yaxisside>
<calc_fnc>2</calc_fnc>
<type>0</type>
<item>
<host>Template App NGINX</host>
<key>nginx.status[writing]</key>
</item>
</graph_item>
</graph_items>
</graph>
<graph>
<name>nginx
status server</name>
<width>900</width>
<height>200</height>
<yaxismin>0.0000</yaxismin>
<yaxismax>100.0000</yaxismax>
<show_work_period>1</show_work_period>
<show_triggers>1</show_triggers>
<type>0</type>
<show_legend>1</show_legend>
<show_3d>0</show_3d>
<percent_left>0.0000</percent_left>
<percent_right>0.0000</percent_right>
<ymin_type_1>0</ymin_type_1>
<ymax_type_1>0</ymax_type_1>
<ymin_item_1>0</ymin_item_1>
<ymax_item_1>0</ymax_item_1>
<graph_items>
<graph_item>
<sortorder>0</sortorder>
<drawtype>0</drawtype>
<color>00C800</color>
<yaxisside>0</yaxisside>
<calc_fnc>2</calc_fnc>
<type>0</type>
<item>
<host>Template App NGINX</host>
<key>nginx.status[accepts]</key>
</item>
</graph_item>
<graph_item>
<sortorder>1</sortorder>
<drawtype>0</drawtype>
<color>C80000</color>
<yaxisside>0</yaxisside>
<calc_fnc>2</calc_fnc>
<type>0</type>
<item>
<host>Template App NGINX</host>
<key>nginx.status[handled]</key>
</item>
</graph_item>
<graph_item>
<sortorder>2</sortorder>
<drawtype>0</drawtype>
<color>0000C8</color>
<yaxisside>0</yaxisside>
<calc_fnc>2</calc_fnc>
<type>0</type>
<item>
<host>Template App NGINX</host>
<key>nginx.status[requests]</key>
</item>
</graph_item>
</graph_items>
</graph>
</graphs>
<value_maps>
<value_map>
<name>Service state</name>
<mappings>
<mapping>
<value>0</value>
<newvalue>Down</newvalue>
</mapping>
<mapping>
<value>1</value>
<newvalue>Up</newvalue>
</mapping>
</mappings>
</value_map>
</value_maps>
</zabbix_export> |
дкzabbixЧАЖЫвГУцЕуЛїХфжУЁњФЃАхЁњЕМШыЃК
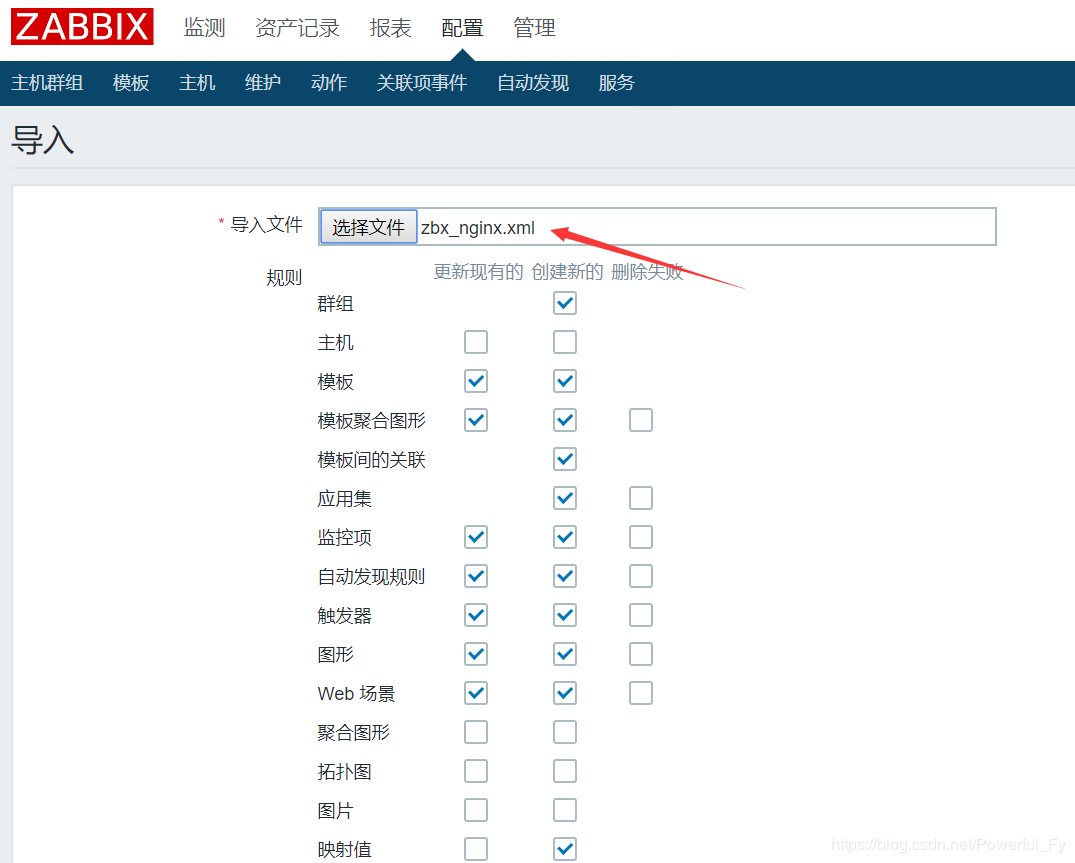
#ЕМШыИеВХДДНЈЕФxmlЮФМўМДПЩ
ЕМШыГЩЙІКѓдкжїЛњСаБэвГУцбЁдёБЛМрПиЕФЛњЦїЃЈBЛњЦїЃЉСДНгИУФЃАхМДПЩПЊЪММрПиnginx
zabbixМрПиTomcat
AЛњЦїЃКzabbixЗўЮёЖЫЃЈ192.168.234.128ЃЉ
BЛњЦїЃКzabbixПЭЛЇЖЫЃЈ192.168.234.125ЃЉ
дкAЛњЦїАВзАzabbix-java-gatewayЃК
[root@zabbix ~]#
wget https://mirrors.tuna.tsinghua.edu.cn/zabbix/zabbix/4.0/rhel/7/x86_64/zabbix-java-gateway-4.0.14-1.el7.x86_64.rpm
[root@zabbix ~]# yum -y localinstall zabbix-java-gateway-4.0.14-1.el7.x86_64.rpm
|
БрМgatewayХфжУЮФМўЃК
| [root@zabbix ~]#
vi /etc/zabbix/zabbix_java_gateway.conf |
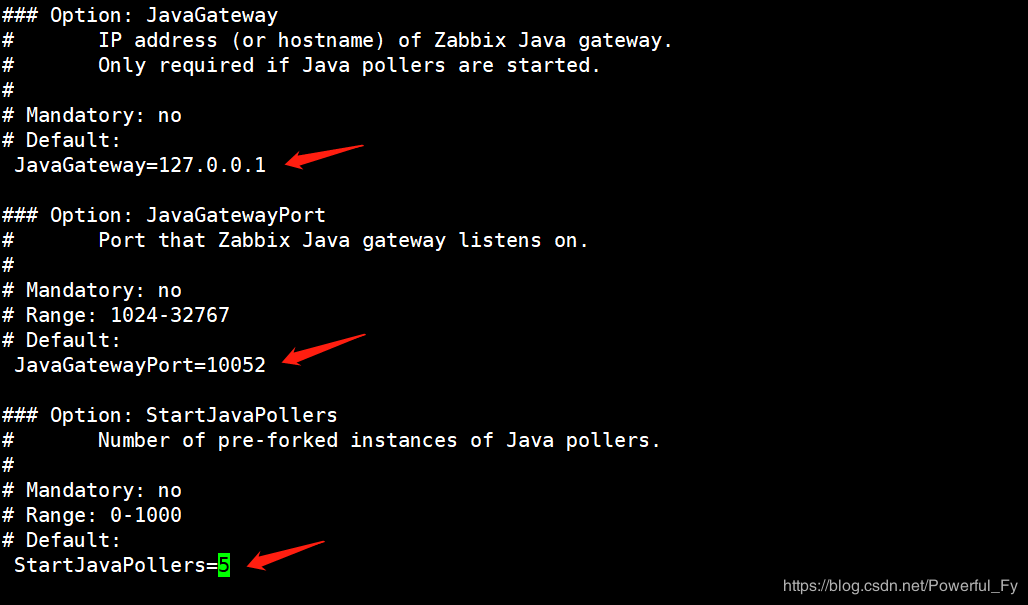
ШЅЕєLISTEN_IPЁЂLISTEN_PORT(МрЬ§ЖЫПк)ЁЂSTART_POLLERS(НјГЬЪ§)ЕФзЂЪЭЗћКХ#ЃК
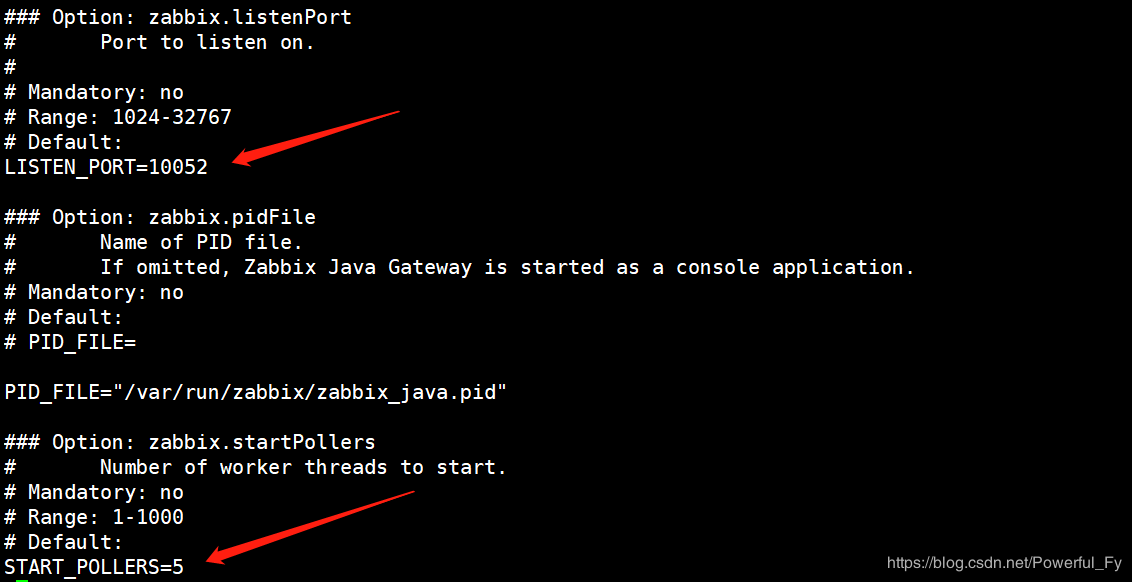
#LISTEN_IPЖЈвхБЛМрПиЛњЦїЕФЕижЗЃЌВЛжИЖЈФЌШЯМрЬ§ШЋВПЛњЦї
БрМserverХфжУЮФМўЃК
| [root@zabbix ~]#
vi /etc/zabbix/zabbix_server.conf |
ЖЈвхвдЯТ3ИіХфжУВЮЪ§ЃК
ЦєЖЏzabbix-java-gatewayЗўЮёЃК
| [root@zabbix ~]#
systemctl start zabbix-java-gateway |
жиЦєzabbix-serverЗўЮёЃК
| [root@zabbix ~]#
systemctl restart zabbix-server |
ВщПДМрЬ§ЖЫПкЃК
[root@zabbix ~]#
netstat -lntp |grep java
tcp6 0 0 :::10052 :::* LISTEN 8706/java |
ПЊЦєJMX
дкBЛњЦїБрМtomcatХфжУЮФМўЃК
| [root@centos ~]#
vi /usr/local/tomcat/bin/catalina.sh |
ЬэМгвдЯТФкШнЃК
export CATALINA_OPTS="$CATALINA_OPTS
-Dcom.sun.management.jmxremote
-Djava.rmi.server.hostname=192.168.234.125
-Dcom.sun.management.jmxremote.port=9999
-Dcom.sun.management.jmxremote.ssl=false
-Dcom.sun.management.jmxremote.authenticate=false" |
#hostnameЖЈвхBЛњЦїЕижЗЃЌЖЫПк9999ЃЈФЌШЯ12345ЃЉ
жиЦєtomcatЃК
[root@centos ~]#
/usr/local/tomcat/bin/shutdown.sh
[root@centos ~]# /usr/local/tomcat/bin/startup.sh
|
ВщПДМрЬ§ЖЫПк9999ЃК
[root@centos ~]#
netstat -lntp |grep 9999
tcp6 0 0 :::9999 :::* LISTEN 25861/java |
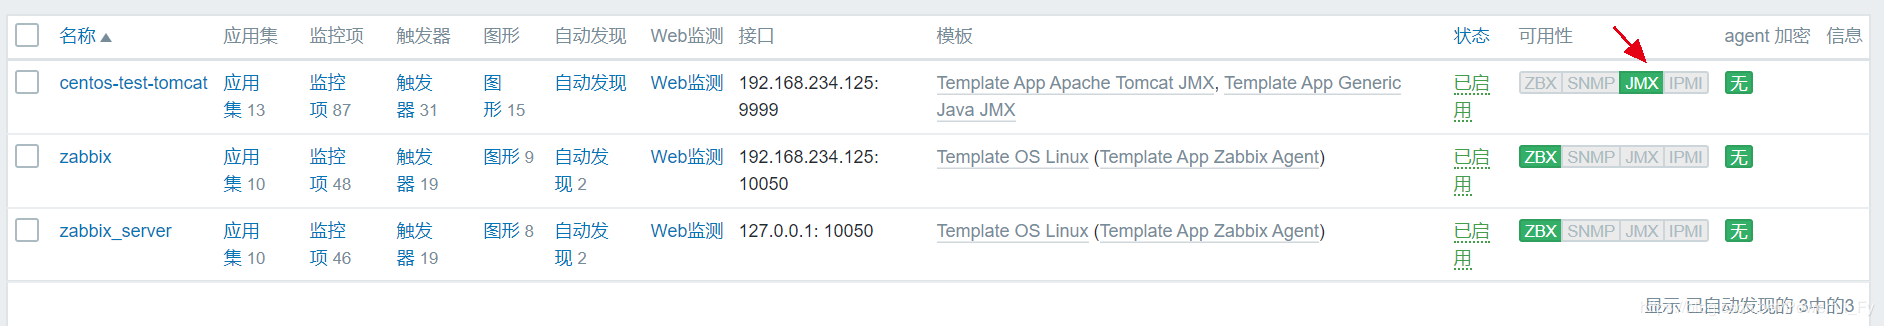
НјШыzabbixЧАЖЫвГУцЬэМгжїЛњЃК
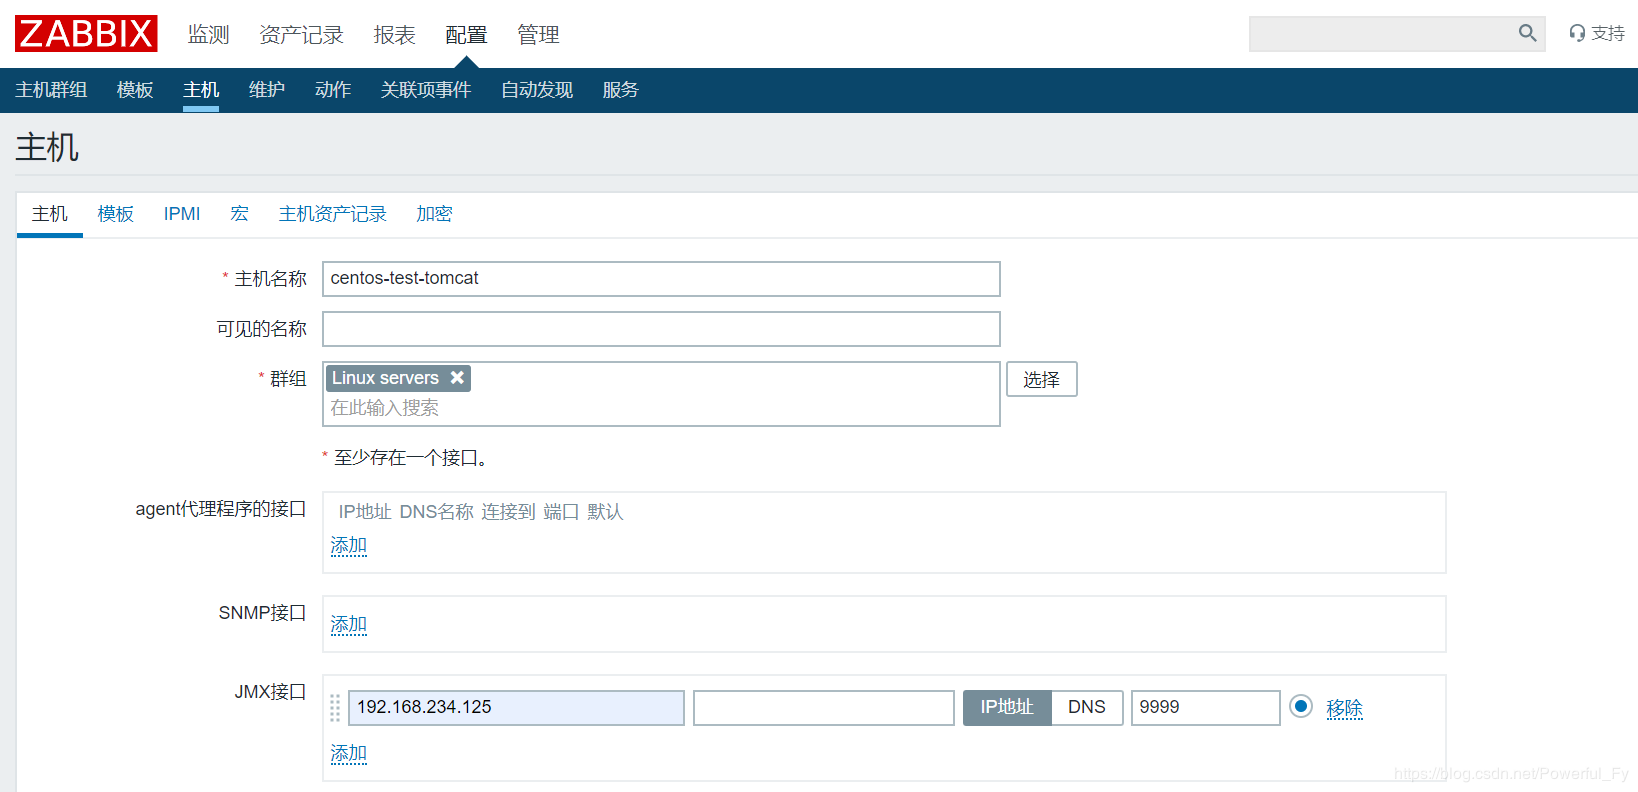
#гыЦеЭЈЧщПіЬэМгМрПижїЛњВЛЭЌЃЌМрПиBЛњЦїЕФtomcatашвЊХфжУJMXНгПк
ФЃАхСДНгJMXЯрЙиЕФСНИіФЃАхЃК
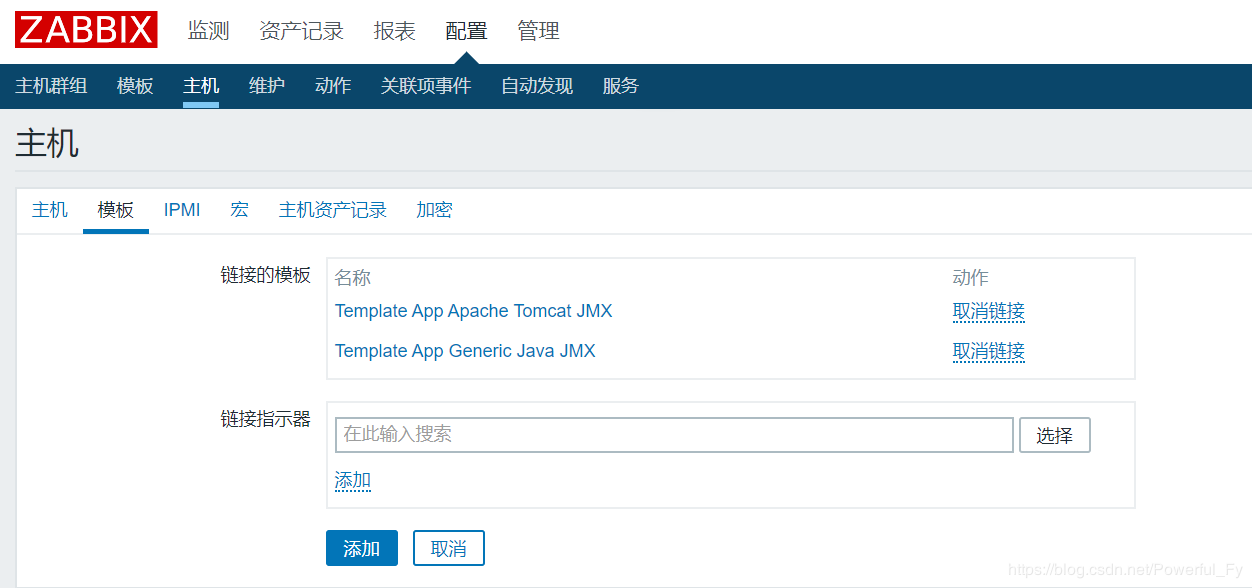
ЕБJMXЭМБъБфТЬМДБэЪОХфжУГЩЙІЃК
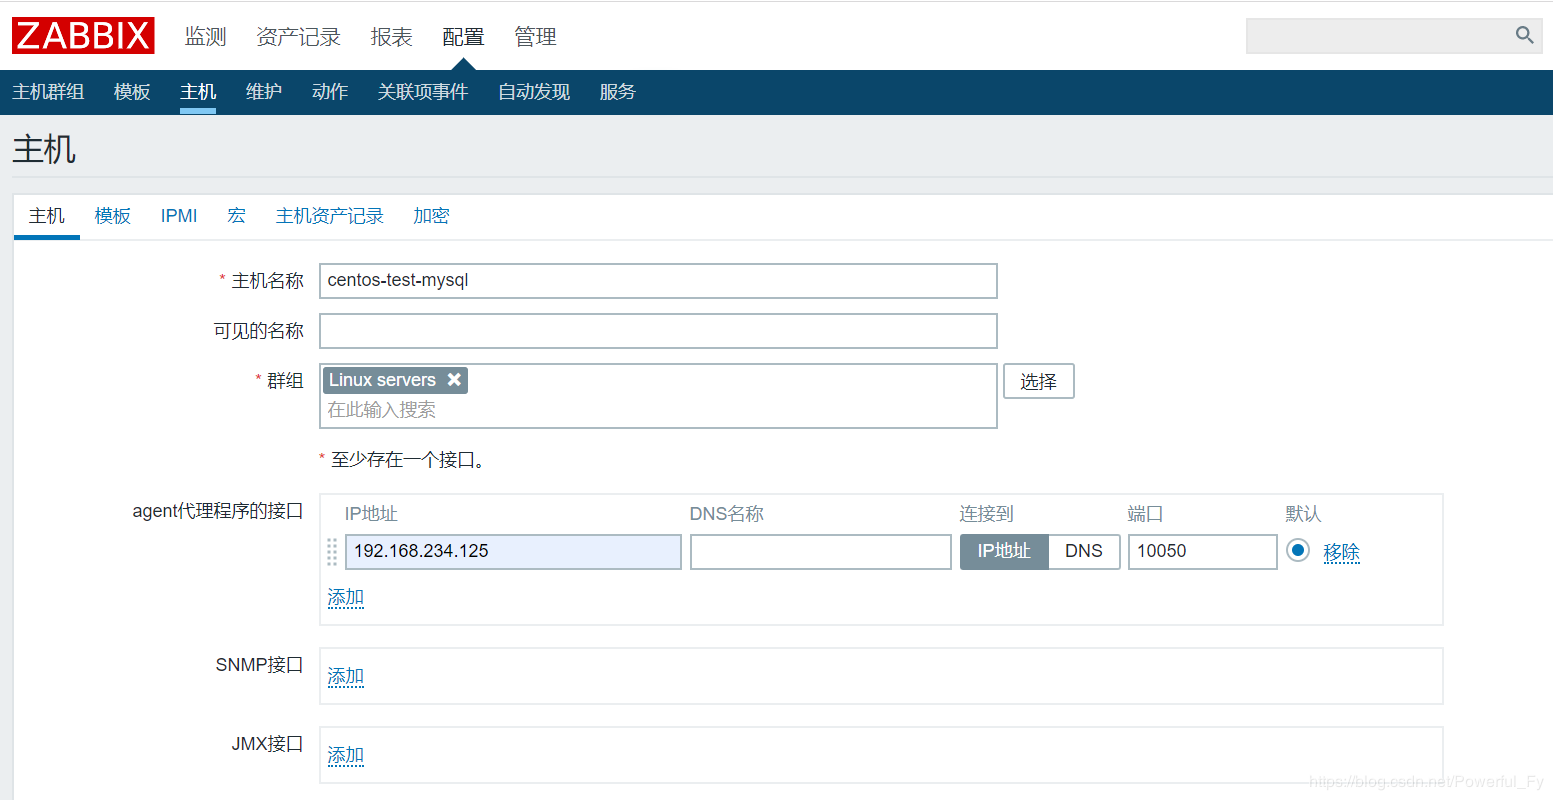
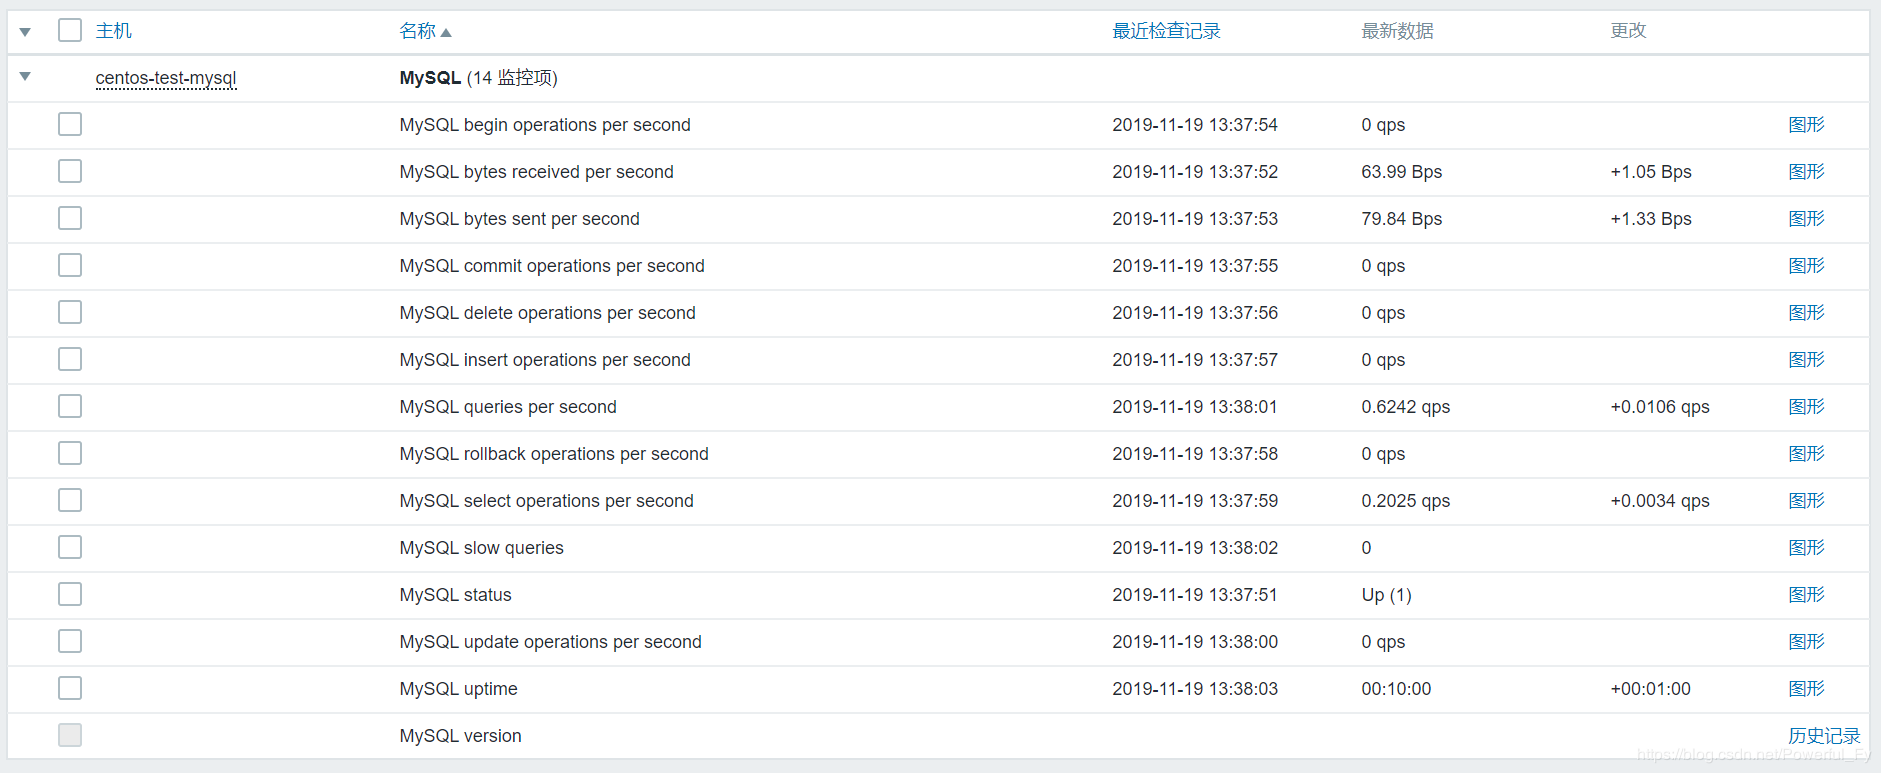
zabbixМрПиMySQL
AЛњЦїЃКzabbixЗўЮёЖЫЃЈ192.168.234.128ЃЉ
BЛњЦїЃКzabbixПЭЛЇЖЫЃЈ192.168.234.125ЃЉ
zabbix_agentЖЈвхmysqlМрПиЕФХфжУЮФМўЃК/etc /zabbix
/zabbix_agentd.d / userparameter_mysql .conf
дкBЛњЦїЕЧТМmysqlДДНЈгУЛЇЃК
| mysql> grant
usage,process,replication client on *.* to zamysql@'localhost'
identified by 'zamysql'; |
ДДНЈХфжУЮФМўжИЖЈЕФФПТМЃК
| [root@centos ~]#
mkdir /var/lib/zabbix |
ДДНЈmy.cnfЮФМўЃК
| [root@centos ~]#
vi /var/lib/zabbix/.my.cnf |
#ашвЊзЂвтИУЮФМўЪЧвўВиЮФМў
ЬэМгвдЯТФкШнЃК
[mysql]
host=localhost
user=zamysql
password='zamysql'
socket=/tmp/mysql.sock
[mysqladmin]
host=localhost
user=zamysql
password='zamysql'
socket=/tmp/mysql.sock |
дкAЛњЦїВтЪдЃК
[root@zabbix ~]#
zabbix_get -s 192.168.234.125 -p 10050 -k mysql.ping
1
[root@zabbix ~]# zabbix_get -s 192.168.234.125
-p 10050 -k mysql.version
mysql Ver 14.14 Distrib 5.6.43, for linux-glibc2.12
(x86_64) using EditLine wrapper
[root@zabbix ~]# zabbix_get -s 192.168.234.125
-p 10050 -k mysql.size
10240 |
#вбГЩЙІЛёШЁЪ§Он
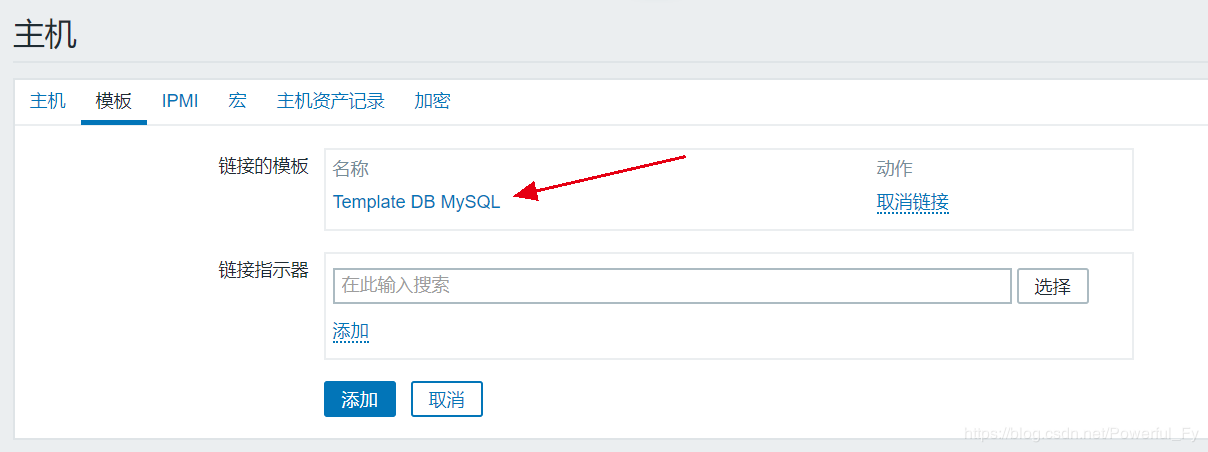
дкzabbixЧАЖЫвГУцЬэМгжїЛњЃК
МрПиФЃАхбЁдёDB mysqlЃК
ZBXБъзМБфЮЊТЬЩЋБэЪОГЩЙІЃК
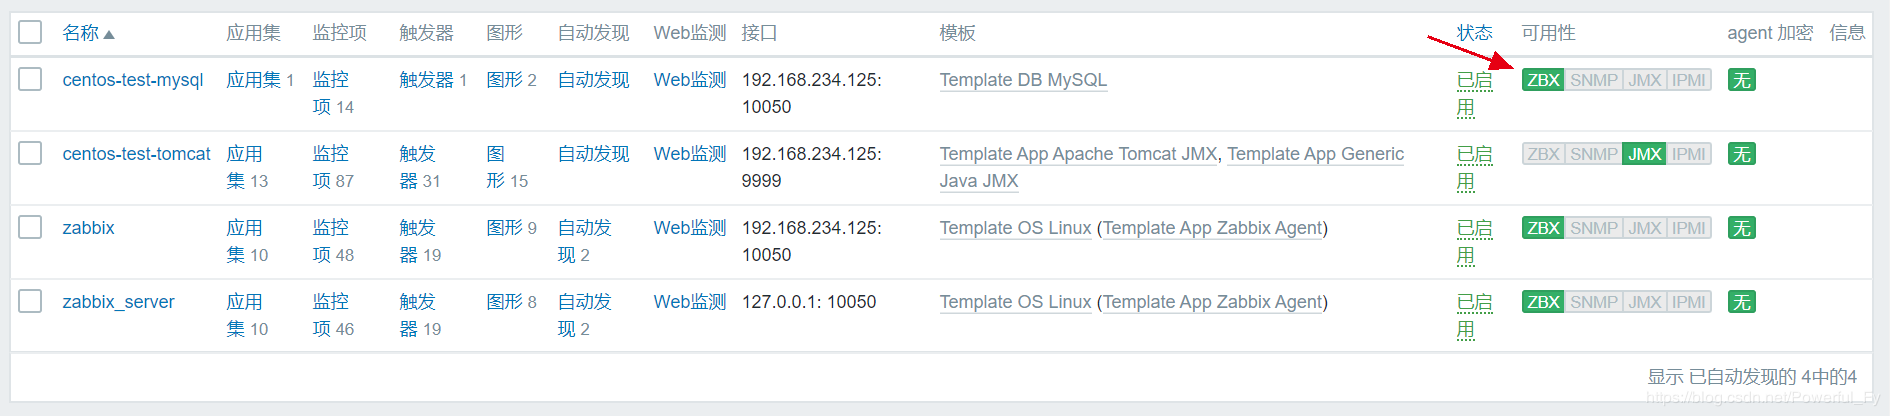
дкМрВтЁњзюаТЪ§ОнвГУцМДПЩВщПДmysqlМрПиЪ§ОнЃК
|