| 这段时间在做HBase的MR
Scan的时候遇上了一个Random Lag behind Task的问题,花了很长时间Trouble
shooting,其间使用各种工具,脚本profile了各种参数,过程大致Share如下,很长,有兴趣的同学随便看看,一开始用英文写的,太长,懒得用中文再写一遍了:
=== Environment ===
1 master node + 4 data/region node,
each with 4 disk. 48G RAM, 16 CPU core
Hadoop 1.1.1, HBase 0.94.1 24/20 Map/Reduce
slots on each node.
Each table is around 50GB, 64~96 Regions
distributed evenly across 4 Region Servers. The data
is generated, and each region have exactly the same
number of keyvalues and almost exactly the same size.
All table have Major Compact done.
Using Map Reduce job to do whole table
scan. Each Region is assigned to a Local Map Task, the
map task just scan the local region, and count rows.
Since map slot number is equal or large than the region
number, the tasks can be assigned within one batch.
=== Problem observation ===
When scanning some specific table,
there are always some lag behind slow map tasks, (usually
cost 150%~200% of the average task run time) And the
top 10 slowest tasks usually locate on the same Region
Server, And if run the same scan job multiple times,
the slowest tasks and their location do not change.
If only judge by the above behavior,
you can suspect that the lag behind Region Server must
have some problem which slow down the whole system.
But the truth is : If you run scan job on different
table, the lag behind Region Server is not the same
one, say, e.g. with table 1, region server A have a
lot of lags behind tasks, while for table 2, it might
be region server B which lags behind.
Last but not least, All these tables
works fine a few days ago, Seems the problem occurs
(or is observed) after a few times of cluster restart.
=== Trouble shooting ===
My trouble shooting procedure is recorded
as below ( with some path finding and misleading works,
but also a few knowledge gained as byproduct)
== Any bottleneck? ==
First of all, supervise the lag Region
Server to check out is there any bottleneck when performing
the scan job. It appears to be nothing abnormal. The
CPU/DISK IO is ok, not reached peak, except that the
overall disk IO throughput is a little bit lower than
the other Region Servers.
== Data locality? ==
If the region's data is actually not
reside on the local data node, then it will also lead
to hot spot region, since it will need to read data
from other nodes.
To make sure that all data is actually
read from local data node, I do a second Major compact
on the table to eliminate the possibility that the region
get relocated and balanced since last major compact.
Then inspect on the network IO when doing MapReduce
scan jobs.
Knowledge : A simple fast way to inspect
network IO together with other system resource is using
"dstat" e.g. dstat -cdnm can supervise CPU
/ Disk IO / network IO / Memory, Cache, Buffer all together.
The observation show to me that there
are no data locality issue, all data is read from local
data node, and no notable network IO. The lag behind
issue still exist after another Major Compact. But there
are some changes been observed. After each Major Compact,
the top 10 slow region seems to change randomly with
weak relationship (say probably still on the same region
server before/after major compact)
Thus, this issue is not related to
data locality.
== Cluster configuration ==
Since this problem is random across
tables. So I also wondering that is there any configuration
I have made for the past days which impact the cluster's
stability? e.g. All memory related setting? Some parameters
fine tune on map reduce framework?
- First of all I look into the GC behavior, since
GC do bring a lot of randomness. And a lot of settings
might influence GC behavior. Say Hadoop/Hbase HeapSize,
GC strategy, Eden area size, HBase block Cache Enable/Disable
etc.
After tuning and comparing different settings on these
parameters ( including restore them to the setting
that I know is working before this problem occurs),
the lag behind issue still exist. Though some settings
do behavior better in the sense of GC time, but don't
solve the lag region issue.
Knowledge:Disable Hbase block cache will reduce GC
time a lot for whole table scan like jobs , for my
50G data, it saves about 10s GC time - observed by
jvisualvm GC plugin. And by default, TableInputFormat
do disable block cache (obviously, since all the data
is accessed only once, they don't need to be cached)
, while if you are writing custom InputFormat, you
need to disable it by yourself.
- Then I try to tune some parameters which related
HDFS/MapReduce/Hbase's concurrent capability, e.g.
Data Node Xceiver/Handler number, RegionServer Handler
number, map slot number, client scan cache size etc.
Though these settings are sync across each node, so
it should not bring random issues. But after all,
I did change these settings for the past days, so
to make sure, I double check and compare different
settings of these parameters. And not surprisingly,
they don't help on this issue.
Knowledge: when there are no obvious bottleneck, Fine
tune of these concurrent related parameters don't
have significant impact on overall cluster performance.
Thus, I believe cluster configuration is out of candidates.
== Profile on slow region server ==
Since for a specific table, the lag
region server is fixed and can be reproduced across
job. So I use JVisualVM to sample Lag Region Server's
lagging Map Task and also sample the region server process.
From the sample result, the Map Task don't show noticeable
different with other tasks. ( That is also reasonable,
since for scan, most jobs is done by Region Server,
client just count the result.) While at the same time,
Region Server's Hotspot method's distribution and percentage
also don’t show noticeable different with other Region
Servers ( well, a few more idle time).
While, still I noticed one difference
that: on Lag Region Server, around the end of the job
duration, each IPC Server Handler thread show a lot
of Lock conflicts, as the following figure shows:
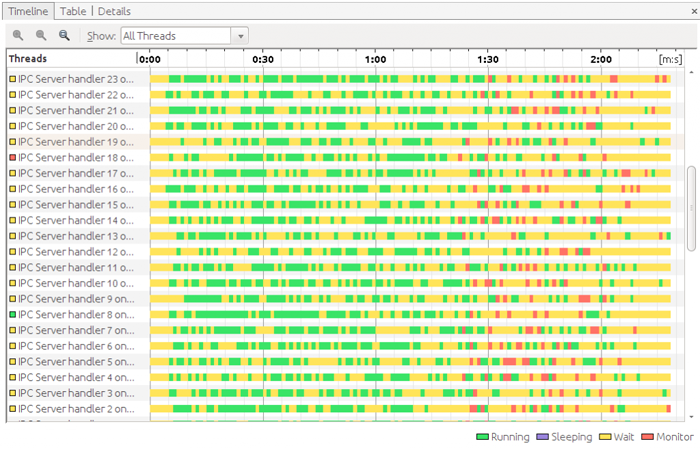
By dump thread detail around locking
time and check for the stack, I can find out that this
happens at HFile block read level :
IPC Server handler 10 on 60020"
daemon prio=10 tid=0x00007f39b02a1800 nid=0x68e4 waiting
for monitor entry [0x00007f39e4fec000]
java.lang.Thread.State: BLOCKED (on
object monitor)
at org.apache.hadoop.hbase.io.hfile.HFileBlock$AbstractFSReader.readAtOffset(HFileBlock.java:1348)
- waiting to lock <0x000000060fc01798>
(a org.apache.hadoop.hdfs.DFSClient$DFSDataInputStream)
By reading code, it shows to me this
is due to multiple scan read on the same store file,
even they actually read at different offset. though
each scan run in it's own thread and have it own scan
instance and env, but the store file handler/reader
itself is shared within region server. ( I don't quite
understand this limit or purpose, to reduce handler
number? To serialize file access?)
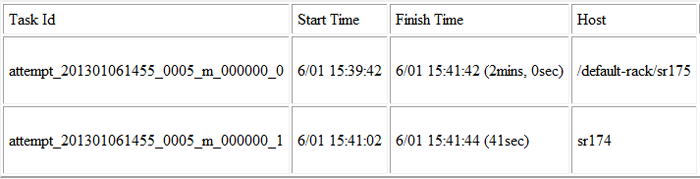
So I can now reasoning that this conflict
is due to map reduce speculate feature, a map task could
be start with multiple instance in case that slow task
is really slow. Then since this second task do scan
on the same region, and my table is major compacted,
thus it read the same store file. Since there are no
block cache during scan, it must do real read from data
node, so wait for lock.
And this speculate feature actually
don't help in my case. This second task is always waiting
for the lock be released from the original task, so
it won't overpass the original task, but finish at about
the same time with the original task, and the original
task always win out. ( I am wondering, actually the
data is replicated across other node, can't we have
a solution to read directly from the other node to get
benefit from the replica, instead of further burden
the lagging node? )
So I disable the speculate feature of
the map reduce framework.
But , this is not the root cause of
my random lag issue, it is just a side effect. The slow
task is already lagging behind, the speculate feature
just make it worse.
== Benchmark Hard disk performance
==
Since no significant data traffic will
be need on network, So I by pass the checking of network.
Then Finally, I decided to check my hard disks. This
don't come to me in the first time because this issue
happen randomly on every region server , And I can hardly
believe my disks on different region server go wrong
at the same time. But now, it is the last thing I can
go to.
- First, I do "hdparm -t" check on every
hard disk on my cluster. Result show as below. (Marked
as OLD*)
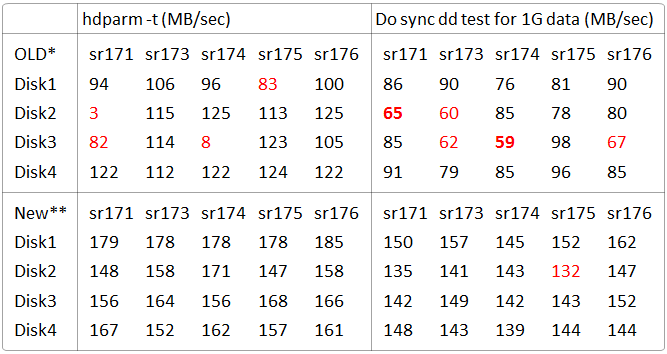
Note * : Old disk sets, most are ST31000528AS
with 3 St31000340NS
Note ** : New disk sets, allST1000DM003-9YN162
Two disks were found with very low
performance of 3 and 8MB/s while the other disks' average
result is 110~120MB/s with a few disk at 90MB/s. (on
sr171, Disk2 is actually not used since this is name/master
node, and only disk1 is used. )
While this disk slow pattern don't
match my job's task slowness pattern. Actually most
of tasks on sr174 run faster than average e.g. on the
previous task speculate example, sr174 is actually help
sr175.
And then, I have a lot of lagging case
happen on sr176, sr175, while it seems sr176 is ok.
And as slow as 8MB/s ? Kidding me.
Since I don't know the internal mechanism
of hdparm test. So I write a script to run dd command
on every disks to double check hard disk performance.
(https://github.com/colorant/misc-scripts/blob/master/ddtest.sh)
Result show on the same table. This time I can see that
there are a few disks performance 20-30% lower than
the other disks, including one from sr176. (Though hdparm
don't show me the other bad performance disks, but which
it says run bad did performance bad in dd case.)
In order to find out why these disks
perform bad, I do both e4defrag to check file fraction
and fsck -c for full disk bad block scan. While no bad
block is found… So why these disks perform bad remain
unknown to me. ( their type are almost the same as Notes
mentioned, with a few exception, but both have good
disk and bad disk)
Anyway, since a lot of disks don't
perform well, I decided to try to replace them all with
a new batch of disks. The performance of the new disks
is also show on the same table. This time, much better
in sense of absolute and relative speed.
== Check blocks allocation ==
With the disks replaced and table rebuilt
with the same data generator. I had hope that the issue
is fixed. But I am not a lucky guy as always. The random
lag problem still exist, though a lot better ( slowest
task now cost around 130~150% average task time, typical
in your cluster?). Approaching, but still not reaching
the performance I have got on previous slower disks
before this issue happened ( though the new disk seems
to have 150% raw speed gain).
Then I decided to check each disk's
throughput on current slow region server during the
job, using dstat to show disk IO upon every second on
sr175, screenshot as below :
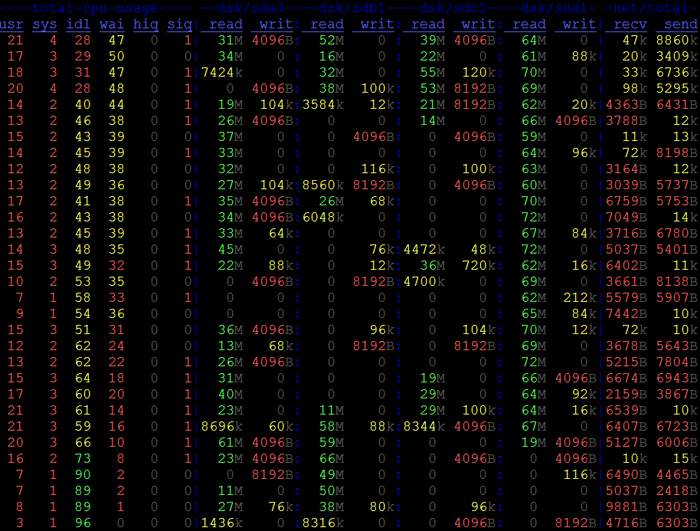
This screenshot show the disk IO for
each disk when approaching the end of job. It is noticed
that, for disk4(sdd1), it is kept busy ( And maybe reach
the peak speed for hbase read? Though not reach the
peak raw speed), while the other disks all have idle
times and throughput up and down...
Thus the best guess is that disk4 have
much more data to serve than other disks.
Since there are no ready cmd to find
out which block on which disk belong to which table
or region. I had to gather the region list belong to
a single node, then writing scripts to use cmd like
"hadoop fsck /path/to/file -files -blocks -locations"
to find out which block the region have, and "find"
cmd to find though all the disks to locate each block's
disk location. ( script for finding block: https://github.com/colorant/misc-scripts/blob/master/hadoop/findblock.sh
) Then aggregate the result. There could be better quick
solution with hdfs API, But these scripts are simple
easy to write, and works fine for me.
The following table shows the local
blocks distribution for a 96 region table
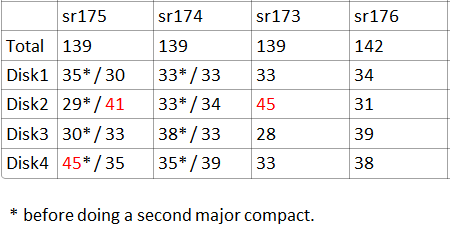
Just read the data with * mark for now.
And yes, Disk4 have 45 blocks which is 50% more than
the other disks. No wonder that it will always be busy.
I guess this is the reason that regions on sr175 lags
behind, it have a hot spot disk. (Though this disk is
not the slowest). And for sr174, blocks are well distributed,
thus sr174 own most of the fastest tasks.
But you will wonder that HDFS should
even out the blocks distribution across disks, how can
this happen. My idea is that, it do even out the blocks
for the whole data, but since it don't know which block
belong to which table and it don't know which data belong
to local region and which is a replica from region which
served by other region server. So it do not or could
do balance work across disks well for single table's
local region data. To double confirm that the overall
blocks is evenly distributed across disks. The following
table show sum of the blocks (local or replica of remote)
on each disks
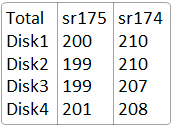
This also explained why a Major compact
could change the slow pattern, but won't resolve the
slow issue. For major compact rewrite the blocks, so
change the block distribution, but if the block is still
not evenly distributed, there still will be hot spot
disks. And this uneven blocks issue might always exist.
Double confirmed by do another major compact and count
the block again. Result show on previous table with
non * marked data.
While one thing I could not make sure
is: you probably noticed on previous disk speed benchmark,
sr175 own the slowest disk ( though just 5-10% slower)
among cluster, Then, it happened that most of the lag
issue also happen on this server. Though hot spot disk
is not necessary the slowest disk itself, but other
disks. Is that because a slow disk make the blocks uneven
distribution issue worse on that node?
And to be noticed that, the uneven
block distribution not necessary do strict 1:1 mapping
to slow region. It just make more chance for hot spot
disk. The real read conflict case also depends on every
region's block scan sequence. Take this table for example.
After a second major compact, sr173's disk2 happen to
have the most (45) blocks. Similar with previous case
on sr175. But the overall job run time is different.
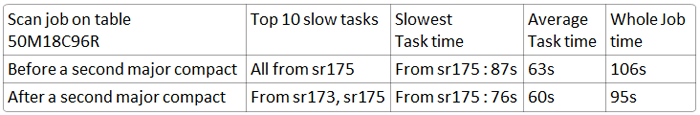
As the table above shows: the overall
blocks distribution still have similar hotspot disks(these
disks have similar raw speed), but on different node.
While the over all run time has a 10% performance difference.
The Result before/after a second major compact is measured
for several times, with very small randomness.
And actually, now the overall job speed
(95s) is a little bit faster than the best result I
got from previous old disks cluster, though not 50%
faster as the raw disk speed is.
=== Why this happen suddenly? ===
Then comes the issue, why I don't observe
this issue before? My best guess is that the original
table is major compacted by me for several times to
get the best result out of it. I stop compact them when
they stay at a "good" block distribution status.
And I count those random slowness issues as "real"
random issues before they get stable. Then the recent
several cluster restart operation some how mess up the
region locality, so I do major compact again to restore
data locality, But this time I pay special attention
to the Lag issue. And also I am not lucky enough to
reach another "good" block distribution status
after several try. Thus it come to me that this issue
suddenly happen. Hmm, this might not be the true case,
but is the best I can guess.
=== Solution? ===
So it seems that this issue is inevitable,
is there some way to some how avoid it? The possible
solutions I can image are :
- Improve block(and replica) allocation strategy
on disks, make it region aware?
- I doubt it will work. e.g. one region have perfect
block distribution on disk1/2/3/4 etc. while another
region also allocate blocks on disk1/2/3/4 , Though
overall there are no hot spot disks, But when
you do scan for each region at the same time in
a MR job…. They conflict on each single disk if
the region scan processed at similar speed…. Maybe
there are better ideal block allocation?
- More disks?
- my cluster has 16 cpu core and 4 disks, so anyway
there will be multiple cpu read on same disks.
With more disks, say 12? It might help to reduce
disk read conflict chance.
- While, what's the typical cpu/disk ration on
industry cluster?
- Faster disks?
- To reduce the hotspot disks' impact. Actually,
if run hdfs on ram disk. You hardly observe Lag
behind regions. While seems ram disk is an extreme
example, In my case, a faster disks helps , but
not as much.
- Smaller block size?
- Thus more blocks with same data size, and hopefully
it will lead to more even block distributions.
- But smaller block size might impact HDFS name
node capability and batch process throughput?
- Tune data node read size?
- Not sure it helps or not. Might reduce conflict
time, or help on busy disks with fewer disk locate
time with bigger read size?
- Make it CPU bound?
- If it is CPU bound, the hot disk won't impact
as much. We can achieve this by e.g. encode the
data on disk. And previous more disks solution
is some how also shift bottleneck from disks to
CPU.
|