| 编辑推荐: |
| 本文来自于饺子,文章详细介绍了使用Docker搭建ELK日志系统的全过程:总体架构图、镜像准备、安装步骤。 |
|
之前用本地版本安装了ELK之后,就没有再去弄它了。年底没那么忙,心里一直惦记,所以最近又开始折腾了。去elastic官网看一下,果然版本帝就是版本帝,一周一版本。现在我用的版本是基于6.1.1版本的。
目标
- 收集Java日志文件,并且根据文件的不同将日志分类,比如:订单日志,客户日志等。
- 日志文件多行处理
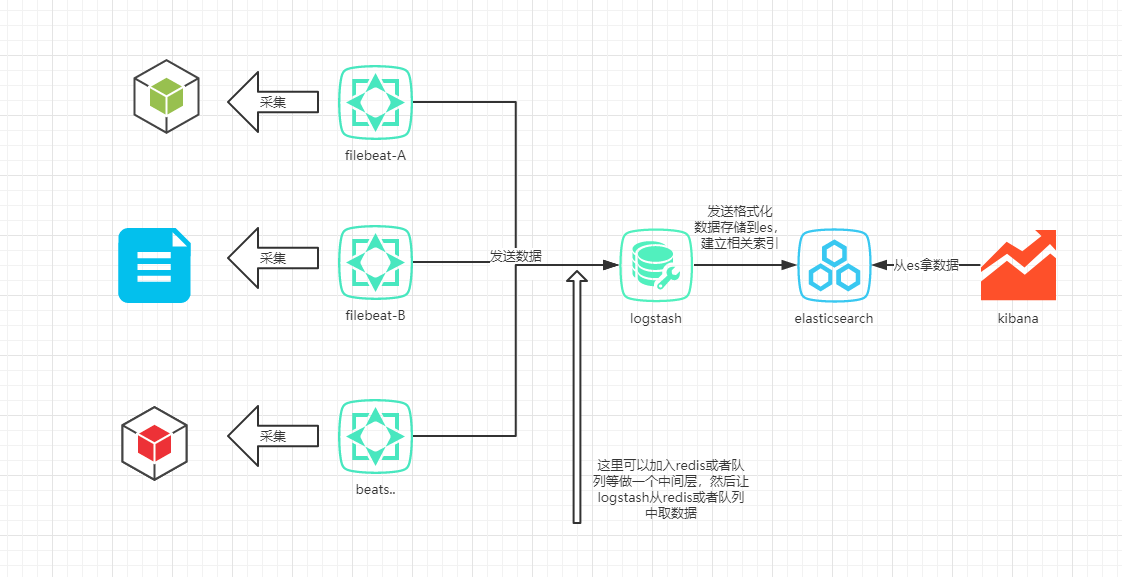
总体架构图
准备镜像
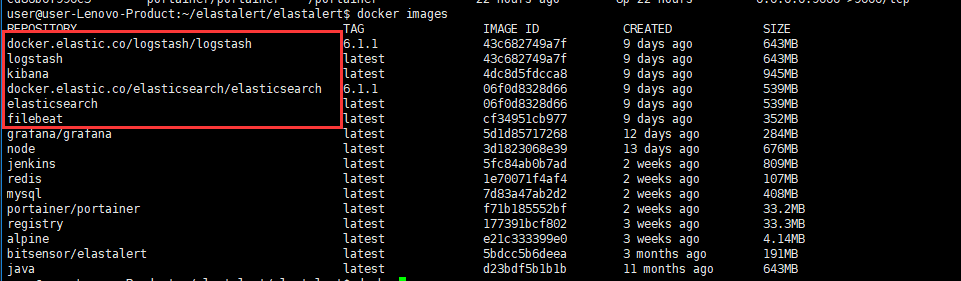
6.0之后官方开始自己维护镜像版本:https://www.docker.elastic.co/。找到需要的ELK镜像地址,pull下来就好了。官方pull下来之后镜像名太长了,所以我将镜像全部重新打了tag,命令:docker tag docker.elastic.co/elasticsearch/elasticsearch:6.1.1 elasticsearch:latest。
使用docker images查看:
安装docker版本ElasticSearch
在elasticsearch的docker版本文档中,官方提到了vm.max_map_count的值在生产环境最少要设置成262144。设置的方式有两种
- 永久性的修改,在/etc/sysctl.conf文件中添加一行:
grep vm.max_map_count /etc/sysctl.conf # 查找当前的值。
vm.max_map_count=262144 # 修改或者新增 |
- 正在运行的机器:
| sysctl -w vm.max_map_count=262144 |
之后我们执行命令,暴露容器的9200,9300端口,方便我们在其它集器上可以通过类似head插件去做es索引的操作等。执行命令为:
| docker run -p 9200:9200 -p 9300:9300 --name elasticsearch -e "discovery.type=single-node" elasticsearch |
如果实际使用中,可能需要设置集群等操作。因实际情况而定。如果你需要存储历史数据,那么就可能需要将data目录保存到本地,使用-v,或者mount参数挂载本地一个目录。
安装docker版本kibana
kibana的作用主要是帮助我们将日志文件可视化。便于我们操作,统计等。它需要ES服务,所以我们将部署好的es和kibana关联起来,主要用到的参数是--link:
| docker run -d -p 5601:5601 --link elasticsearch -e ELASTICSEARCH_URL=http://elasticsearch:9200 kibana |
使用link参数,会在kibana容器hosts文件中加入elasticsearch ip地址,这样我们就直接通过定义的name来访问es服务了。
安装logstash和filebeat
前面的kibana和ES的安装,如果我们在开发环境中并不需要太多的关注他们的详细配置。但是logstash和filebeat我们需要注意下它的配置,因为这两者是我们完成需求的重要点。
logstash我们只让它进行日志处理,处理完之后将其输出到elasticsearch。
filebeat是一个轻量级收集器,我们使用它来收集Java日志,将不同文件夹下的日志进行tag,处理多行日志行为(主要针对Java异常信息),之后发送给logstash。
日志的文件格式大概就是:DATE LOG-LEVEL LOG-MESSAGE,格式是在log4j.properties中定义的。你也可以自己定义输出格式。
现在我们定义logstash.conf,主要在logstash中使用grok filter插件。
logstash.conf:
input {
beats {
#host => "localhost"
port => "5043"
}
}
filter {
if [fields][doc_type] == 'order' {
grok {
match => { "message" => "%{TIMESTAMP_ISO8601:timestamp} %{LOGLEVEL:level} %{JAVALOGMESSAGE:msg}" }
}
}
if [fields][doc_type] == 'customer' { # 这里写两个一样的grok,实际上可能出现多种不同的日志格式,这里做个提示而已,当然如果是相同的格式,这里可以不写的
grok {
match => { "message" => "%{TIMESTAMP_ISO8601:timestamp} %{LOGLEVEL:level} %{JAVALOGMESSAGE:msg}" }
}
}
}
output {
stdout { codec => rubydebug }
elasticsearch {
hosts => [ "localhost:9200" ]
index => "%{[fields][doc_type]}-%{+YYYY.MM.dd}"
}
} |
在logstash.conf中,我们主要使用[fields][doc_type]来标明日志的类型,这个值实在filebeat中定义的。
现在我们假定需要收集两个目录下的日志文件:/home/user/elk/customer/*.log,/home/user/elk/order/*.log:
customer.log:
2017-12-26 10:05:56,476 INFO ConfigClusterResolver:43 - Resolving eureka endpoints via configuration
2017-12-26 10:07:23,529 INFO WarehouseController: 271 - findWarehouseList,json{"formJSON": {"userId":"885769620971720708"},"requestParameterMap":{},"requestAttrMap" :{"name":"asdf","user":"8857696","ip":"183.63.112.1","source":"asdfa", "customerId":"885768861337128965","IMEI":"863267033748196", "sessionId":"xm1cile2bcmb15wtqmjno7tgz", "sfUSCSsadDDD":"asdf/10069&ADR&1080&1920&OPPO R9s Plus&Android6.0.1", "URI":"/warehouse-service/appWarehouse/findByCustomerId.apec", "encryptType":"2", "requestStartTime":3450671468321405}}
2017-12-26 10:07:23,650 INFO WarehouseServiceImpl:325 - warehouse list:8,warehouse str: [{"addressDetail":"nnnnnnnn","areaId":"210624","areaNa":""}]
2017-12-26 10:10:56,477 INFO ConfigClusterResolver:43 - Resolving eureka endpoints via configuration
2017-12-26 10:15:56,477 INFO ConfigClusterResolver:43 - Resolving eureka endpoints via configuration
2017-12-26 10:20:56,478 INFO ConfigClusterResolver:43 - Resolving eureka endpoints via configuration
2017-12-26 10:05:56,476 INFO ConfigClusterResolver:43 - Resolving eureka endpoints via configuration
2017-12-26 10:07:23,529 INFO WarehouseController:271 - findWarehouseList,json{"formJSON":{"userId":"885769620971720708"}}]
2017-12-26 10:10:56,477 INFO ConfigClusterResolver:43 - Resolving eureka endpoints via configuration
2017-12-26 10:15:56,477 INFO ConfigClusterResolver:43 - Resolving eureka endpoints via configuration
2017-12-26 10:20:56,478 INFO ConfigClusterResolver:43 - Resolving eureka endpoints via configuration |
order.log:
2017-12-26 11:29:19,374 INFO WebLogAspect:53 -- 请求:18,SPEND TIME:0
2017-12-26 11:38:20,404 INFO NoticeServiceApplication:664 -- The following profiles are active: test
2017-12-26 11:41:07,754 INFO NoticeServiceApplication:664 -- The following profiles are active: test
2017-12-26 12:38:58,683 INFO RedisClusterConfig:107 -- //// --- 启动单点Redis ---
2017-12-26 12:39:00,325 DEBUG ApplicationContextRegister:26 --
2017-12-26 12:39:06,961 INFO NoticeServiceApplication:57 -- Started NoticeServiceApplication in 17.667 seconds (JVM running for 18.377)
2017-12-26 11:27:56,577 INFO WebLogAspect:51 -- 请求:19,RESPONSE:"{\"data\":null,\"errorCode\":\"\",\"errorMsg\":\"\",\"repeatAct\":\"\", \"succeed\":true}"
2017-12-26 11:27:56,577 INFO WebLogAspect:53 -- 请求:19,SPEND TIME:1
2017-12-26 11:28:09,829 INFO WebLogAspect:42 -- 请求:20, URL:http://192.168.7.203:30004/sr/flushCache
2017-12-26 11:28:09,830 INFO WebLogAspect:43 -- 请求:20,HTTP_METHOD:POST
2017-12-26 11:28:09,830 INFO WebLogAspect:44 -- 请求:20,IP:192.168.7.98
2017-12-26 11:28:09,830 INFO WebLogAspect:45 -- 请求:20, CLASS_METHOD:com.notice.web.estrictController
2017-12-26 11:28:09,830 INFO WebLogAspect:46 -- 请求:20,METHOD:flushRestrict
2017-12-26 11:28:09,830 INFO WebLogAspect:47 -- 请求:20,ARGS:["{\n}"]
2017-12-26 11:28:09,830 DEBUG SystemRestrictController:231 -- 刷新权限限制链
2017-12-26 11:38:20,404 INFO NoticeServiceApplication:664 -- The following profiles are active: test
2017-12-26 11:41:07,754 INFO NoticeServiceApplication:664 -- The following profiles are active: test
2017-12-26 11:41:40,664 INFO NoticeServiceApplication:664 -- The following profiles are active: test
2017-12-26 11:43:38,224 INFO NoticeServiceApplication:664 -- The following profiles are active: test
2017-12-26 11:47:49,141 INFO NoticeServiceApplication:664 -- The following profiles are active: test
2017-12-26 11:51:02,525 INFO NoticeServiceApplication:664 -- The following profiles are active: test
2017-12-26 11:52:28,726 INFO NoticeServiceApplication:664 -- The following profiles are active: test
2017-12-26 11:53:55,301 INFO NoticeServiceApplication:664 -- The following profiles are active: test
2017-12-26 11:54:26,717 INFO NoticeServiceApplication:664 -- The following profiles are active: test
2017-12-26 11:58:48,834 INFO NoticeServiceApplication:664 -- The following profiles are active: test
2017-12-26 12:38:51,126 INFO NoticeServiceApplication:664 -- The following profiles are active: test
2017-12-26 12:38:58,683 INFO RedisClusterConfig:107 -- //// --- 启动单点Redis ---
2017-12-26 12:39:00,325 DEBUG ApplicationContextRegister:26 -- ApplicationContextRegister.setApplicationContext: applicationContextorg.springframework.boot.context. embedded.AnnotationConfigEmbeddedWebApplicationContext@5f150435: startup date [Tue Dec 26 12:38:51 CST 2017]; parent: org.springframework.context.annotation.AnnotationConfigApplicationContext@63c12fb0
2017-12-26 12:39:06,961 INFO NoticeServiceApplication:57 -- Started NoticeServiceApplication in 17.667 seconds (JVM running for 18.377) |
日志的文件格式大概就是:DATE LOG-LEVEL LOG-MESSAGE,格式我们是在log4j.properties中定义的。你可以自己定义,自定义注意修改logstash.conf中的grok就好。
之后解决我们的filebeat要解决的问题:收集日志,处理多行日志,给日志打标签。在filebeat.yml中,如下定义:
filebeat.yml
filebeat.prospectors:
- paths:
- /home/user/elk/logs/order/*.log
multiline:
pattern: ^\d{4}
negate: true
match: after
fields:
doc_type: order
- paths:
- /home/user/elk/logs/customer/*.log
multiline:
pattern: ^\d{4}
negate: true
match: after
fields:
doc_type: customer
output.logstash: # 输出地址
hosts: ["logstash:5043"]
|
- 收集日志:直接使用prospector定位并且处理日志文件。
- 多行日志: 根据日志格式,我们开头都是yyyy,类似与纯4个数字,所以我们使用multile插件,做配置就好。官方的文档挺详细的,主要就是实践:filebeat multiline https://www.elastic.co/guide/en/beats/filebeat/current/multiline-examples.html
- 打标签:这个是最重要的,主要的目的是让logstash知道filebeat发送给它的消息是那个类型,然后logstash发送到es的时候,我们可以建立相关索引。这里的fields是内置的,doc_type是自定义的。
之前的document_type 在5.5.0中就已经废弃了。https://www.elastic.co/guide/en/beats/libbeat/6.1/release-notes-5.5.0.html#_deprecated_6
了解这些之后,我们启动我们的logstash和filebeat。
启动docker版本的logstash:
| docker run -it --name logstash --link elasticsearch -d -v ~/elk/yaml/logstash.conf:/usr/share/logstash/pipeline/logstash.conf logstash |
启动filebeat,将文件挂载到容器中,这里也可以有其它的处理方法,你可以根据自己的需求来。
| docker run --name filebeat -d --link logstash -v ~/elk/yaml/filebeat.yml:/usr/share/filebeat/filebeat.yml -v ~/elk/logs/:/home/logs/ filebeat |
最后记得在kibana里面建立索引(create index)的时候,默认使用的是logstash,而我们是自定义的doc_type,所以你需要输入order*,customer*这样就可以建立两个索引了。
之后就可以在kibana的Discovery里面看到你配置的了
如果你直接用我的log,请将时间稍微改一下,2017-12-26改为当天实验年月。
上面的命令我都自己实践过,是可以用的,注意下-v参数挂载的几个本地盘的地址。还有filebeat收集的地址。
配置文件地址仓库:使用Docker搭建ELK日志系统(https://github.com/chenzhijun/elk),仓库配有docker-compose.yml文件在根目录下直接运行docker-compose up 就可以看到实际效果了(记得改下日志时间)。
|